Band 5.0 IELTS Writing Task 1 Model Answer
Overall Band Score: 5.0 · Cambridge IELTS 15 · 2026-11-15
IELTS Writing Task 1 question
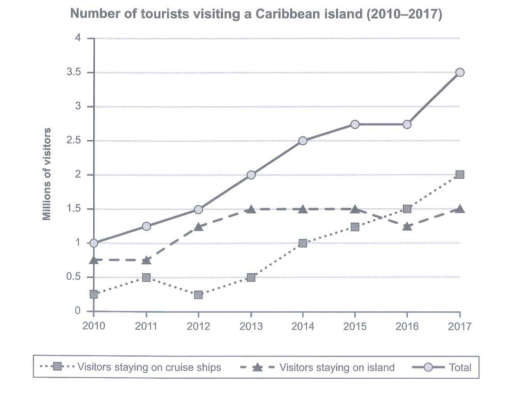
The graph below shows the number of tourists visiting a particular Caribbean island between 2010 and 2017.
Summarize the information by selecting and reporting the main features and make comparisons where relevant.
Student answer (Band 5.0)
The given line graph illustrate the number of of visitors viiting a particular caribbean island from 2010 to 2017. The figure are in millions.
To begin with, In 2010, visitors staying on cruise ships were only 0.3 millions. Then [redacted phone] the millions of visitors were flaculating. In 2013 the millions of visitors are 0.5. Cruise ships has its own different fun. In 2014 the visitors staying on cruise ships were 1 millions. From [redacted phone] visitors staying on cruise ships were rapidly increased upto 2 millions.
Moreover, visitors staying on island were similar from 2010 to 2011 which is 0.3 millions. From 2011 to 2013 the millions of visitors were increased by 1.5 millions. Staying on island is more relaxing, tourists can stay stress free. Hence from 2013 to 2015 the similar on same figure 1.5 millions. Then after one deacde the millions of vistors is increasing and decreasing and after two years it is 1.5 millions again in 2017.
Overall, visitors staying on cruise is rapidly incresed from 2013 to 2017. Visitors staying on island is flaculating.
AI examiner evaluation
| Criterion | Band |
|---|---|
| Task Achievement / Task Response | 5.0 |
| Coherence and Cohesion | 5.5 |
| Lexical Resource | 4.5 |
| Grammatical Range and Accuracy | 5.0 |
| Overall | 5.0 |
Task Achievement / Task Response: Band 5.0
You identify the period and both visitor categories, and you report the broad rise in cruise-ship visitors. However, the account only partially selects and reports the graph’s main features, and several figures are inaccurate: island visitors were about 0.75 million in 2010 and 2011, not 0.3 million, while the rise from 2011 to 2013 was about 0.75 million, not 1.5 million. The claim that island visitors increased and decreased after 2015 is also unclear; they fell slightly in 2016 and returned to about 1.5 million in 2017. The overview mentions fluctuation but misses the key comparison that total visitors rose substantially, reaching 3.5 million, and cruise-ship numbers overtook island stays by 2017. Focus on accurate trends and comparisons rather than unrelated commentary.
Coherence and Cohesion: Band 5.5
The response has separate paragraphs and uses basic sequencing signals such as “To begin with,” “Moreover,” and “Overall,” so the reader can recognise an attempt to organise the report. However, progression is uneven: the first paragraph moves from cruise-ship figures to the unrelated statement “Cruise ships has its own different fun,” and the island paragraph includes comments about relaxation and stress that do not help describe the graph. Some links are unclear, particularly “Then after one deacde” and “after two years,” which make the timeline difficult to follow. The overview repeats the idea of fluctuation without bringing the main trends together. Group the data by category or by stages, use clear year references, and reserve each paragraph for graph information.
Lexical Resource: Band 4.5
You use some relevant task vocabulary, including “visitors,” “millions,” “increased,” and “fluctuating,” which helps communicate the general subject. However, the range is limited and several choices or forms are inaccurate or awkward, sometimes making the meaning difficult to follow. For example, “the millions of visitors were flaculating” is not a natural way to describe changing figures, and “Cruise ships has its own different fun” is irrelevant and unclear in this report. Spelling errors such as “viiting,” “caribbean,” “deacde,” and “incresed” also reduce control. Practise precise trend language and check spelling; use expressions such as “the figure fluctuated” or “the number rose steadily” rather than repeating “millions of visitors.”
Grammatical Range and Accuracy: Band 5.0
You attempt both short statements and longer time-based sentences, and the reader can understand some basic information. However, the range is limited, and frequent errors in sentence structure, tense, agreement, and number affect clarity. Examples include “The given line graph illustrate” (subject–verb agreement), “The figure are” (agreement), and “Cruise ships has” (agreement). The sentence “From 2011 to 2013 the millions of visitors were increased by 1.5 millions” uses an incorrect passive form and an unclear plural construction. Articles and punctuation are also inconsistent, as in “In 2010, visitors…” followed by irregular spacing and capitalisation. Build accurate simple sentences first, then practise combining them with time clauses while keeping verbs in the past tense.
See this exact question answered at other band scores. The same prompt compared across bands.
Browse more IELTS Writing model answers or get your own writing scored by the same AI examiner.