Band 5.0 IELTS Writing Task 1 Model Answer
Overall Band Score: 5.0 · Cambridge IELTS 15 · 2026-11-16
IELTS Writing Task 1 question
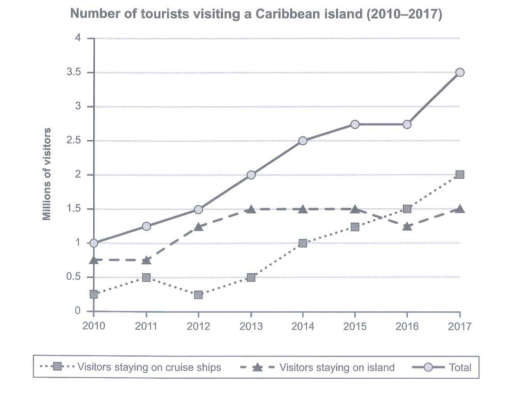
The graph below shows the number of tourists visiting a particular Caribbean island between 2010 and 2017.
Summarize the information by selecting and reporting the main features and make comparisons where relevant.
Student answer (Band 5.0)
the given barchart show the number of tourists visiting a caribbean island along with number of popple staying on cruise ships and on island
According to chart the population of tourist was increasing every year.in , 2011 and 2015 tourist was increase by only 2-3%.in between [redacted phone] drastic increasment was observe which contain about 6-7% then perivous years.in 2013 and 2014 it was increase by 5%but in 2015 -2016 tourist was stayed constant.
in one hand visitor stying on cruise ships was more than 0.5% in 2010 and stayed same in 2011.in 2012 small increment was observe that was 1.2%.in between 2013 to 2015 ;1.5% mass were staying in cruise ships .in 2016 it decrease to 1.3%and again in 2017 it up lift to1.5%.
one other hand ,less than 0.5% were staying on island in 2010.unfortunatly in 2012 it go back to lass than o.5%and again come up to 0.5%in 2013 .in 2014 it reach to 1%then in 2015 it goes to 1.3%.in 2016 it goes to 1.5 in 2017 it emded to 2%
in conclusion at first tourist prefer staying on curise ship later in between [redacted phone] the demand to stay on island got increased.
AI examiner evaluation
| Criterion | Band |
|---|---|
| Task Achievement / Task Response | 5.0 |
| Coherence and Cohesion | 5.5 |
| Lexical Resource | 5.0 |
| Grammatical Range and Accuracy | 5.0 |
| Overall | 5.0 |
Task Achievement / Task Response: Band 5.0
You identify the broad rise in total visitors and attempt to compare the two accommodation groups, so the response is relevant to the graph. However, the account only partially reports the main features because several figures and series are confused. For example, cruise-ship visitors were about 0.25 million in 2010, not “more than 0.5%,” and island visitors were about 0.75 million that year, not less than 0.5%. The later descriptions also reverse the series: cruise visitors reached 2 million in 2017, while island visitors were about 1.5 million. The overview that totals increased is useful, but the final claim that tourists initially preferred cruise ships is unsupported. Focus on accurate overall trends and key comparisons before adding figures.
Coherence and Cohesion: Band 5.5
The response has an identifiable opening, several sections about the data, and a concluding sentence, which gives it some organisation. However, progression is difficult to follow because the figures for cruise-ship and island visitors are repeatedly mixed up, and the paragraph beginning “in one hand” does not clearly signal which series it describes. Connectors such as “in one hand,” “one other hand,” and “in conclusion” are either inaccurate or used mechanically. The sequence of years is generally chronological, but the discussion jumps between totals and accommodation categories without a clear plan. Group the total trend in one paragraph, then compare the two visitor types in another, using accurate labels and simple transitions such as “By contrast” and “Meanwhile.”
Lexical Resource: Band 5.0
You use some task-related vocabulary, including “tourists,” “visitors,” “increased,” and “stayed constant,” and you attempt to describe changes over time. However, the range is limited and many word choices or spellings make the meaning difficult to interpret. Examples include “drastic increasment,” “mass were staying,” “up lift,” and “emded.” The repeated use of “increase” also makes the account less precise, while “population” is not an appropriate term for the number of tourists. Use standard graph language and distinguish rises, falls, and stable periods. Accurate terms such as “visitor numbers,” “rose,” “declined,” and “remained unchanged” would make the comparisons clearer and more natural.
Grammatical Range and Accuracy: Band 5.0
The response attempts to describe trends using past-tense clauses and some time expressions, but the sentence structures are mostly simple and frequent errors make relationships between ideas hard to follow. For example, “the population of tourist was increasing every year” has problems with number and verb agreement, while “in 2013 and 2014 it was increase by 5%” uses an incorrect verb form. Several sentences also lack clear punctuation or complete grammatical structure, as in “in between 2016-2017 drastic increasment was observe.” Articles, plurals, and tense forms are often missing or inconsistent. Practise forming clear past-tense sentences with a subject and verb, such as “The total number of visitors rose from…” and use full stops to separate each comparison.
See this exact question answered at other band scores. The same prompt compared across bands.
Browse more IELTS Writing model answers or get your own writing scored by the same AI examiner.