Band 5.0 IELTS Writing Task 1 Model Answer
Overall Band Score: 5.0 · Cambridge IELTS 15 · 2026-11-16
IELTS Writing Task 1 question
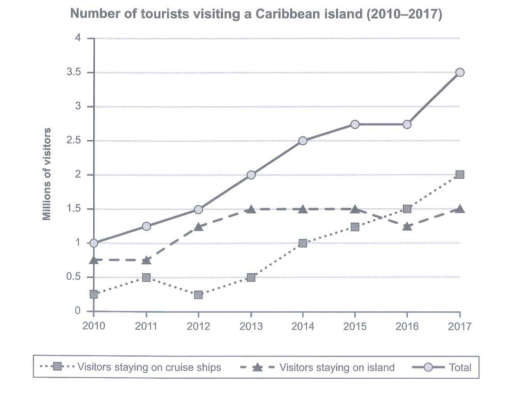
The graph below shows the number of tourists visiting a particular Caribbean island between 2010 and 2017.
Summarize the information by selecting and reporting the main features and make comparisons where relevant.
Student answer (Band 5.0)
The graph represents the ratio of tourists visiting a particular Caribbean island from 2010 to 2017.
It is clear from the graph that the total number of visitors increases from 2010 to 2017 and reaches its highest ratio at 2017.
Starting from bar chart the first and the least total ratio year is 2010 and the total number of visitors is 1 million and the ratio of visitors staying on cruise ships is almost 0.3% and that of staying on island is almost 0.7%.The year 2017 is the largest total ratio year with a total ratio of 3.5 million visitors and the number of visitors staying on cruise ships exceeded with 2 million and that of island is 1.5 million.Another year is 2011 the total number of visitors are about 1.3 million and the ratio of staying on cruise ships is 0.5 and that of on island is about 0.8.Other years 2011 to 2016 the total number of visitors gradually inreases and remains 1.5 to 3 millions.
AI examiner evaluation
| Criterion | Band |
|---|---|
| Task Achievement / Task Response | 5.5 |
| Coherence and Cohesion | 5.0 |
| Lexical Resource | 5.0 |
| Grammatical Range and Accuracy | 5.0 |
| Overall | 5.0 |
Task Achievement / Task Response: Band 5.5
You identify the overall rise in total visitors and give relevant figures for 2010 and 2017, including the changing contribution of cruise-ship visitors. However, the account covers the middle years only vaguely: saying totals “gradually inreases and remains 1.5 to 3 millions” misses the key pattern that the total reaches about 2.75 million in both 2015 and 2016 before rising to 3.5 million. The description of 2011 is also approximate, and the response does not clearly compare the two visitor categories across the period. The overview is relevant but limited to the total increase. To strengthen the report, select the main stages and turning points, and describe how island-staying numbers level off while cruise-ship numbers rise.
Coherence and Cohesion: Band 5.0
The response has a basic sequence: an opening statement, a brief overview, and then figures for selected years. This gives the reader some organisation, but the progression is not consistently clear. The move from 2010 to 2017 and then back to 2011 (“Another year is 2011”) disrupts the chronological account, while “Other years 2011 to 2016” is too broad to connect the figures into a clear comparison. There is also little paragraphing or use of linking language to distinguish the overview from the detailed data. Organise the body chronologically or by visitor category, and use clear transitions such as “By contrast” or “From 2014 onwards” to show relationships between trends.
Lexical Resource: Band 5.0
You use some relevant task vocabulary, including “total number of visitors,” “staying on cruise ships,” and “highest.” However, the range is limited and several expressions are repeated or imprecise. “Ratio” is used repeatedly for visitor numbers, although the graph reports numbers in millions, not proportions; “largest total ratio year” is also an unnatural way to describe the peak. The phrase “exceeded with 2 million” does not clearly express that cruise-ship visitors reached two million. There is also a spelling error in “inreases.” Use precise terms such as “figure,” “number,” “rose,” and “accounted for,” and vary the language used to describe increases and stable values.
Grammatical Range and Accuracy: Band 5.0
The response communicates its main points, but sentence structures are mostly simple, with limited control when ideas are combined. Several sentences contain errors in agreement or sentence construction, for example, “the total number of visitors are about 1.3 million” and “the number of visitors staying on cruise ships exceeded with 2 million.” The long sentence beginning “Starting from bar chart” also joins several pieces of information without clear punctuation, making it harder to follow. Articles and prepositions are sometimes missing or awkward, as in “staying on island.” Practise accurate comparative and reporting structures, such as “the figure for cruise-ship visitors rose to…” and “the number staying on the island remained at…,” and separate data points into controlled sentences.
See this exact question answered at other band scores. The same prompt compared across bands.
Browse more IELTS Writing model answers or get your own writing scored by the same AI examiner.