Band 5.5 IELTS Writing Task 1 Model Answer
Overall Band Score: 5.5 · Cambridge IELTS 15 · 2026-11-17
IELTS Writing Task 1 question
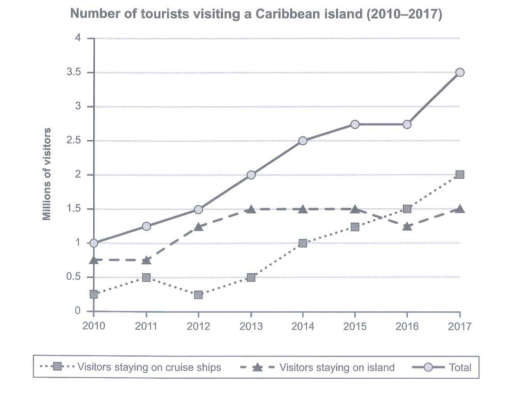
The graph below shows the number of tourists visiting a particular Caribbean island between 2010 and 2017.
Summarize the information by selecting and reporting the main features and make comparisons where relevant.
Student answer (Band 5.5)
Below chart give the information on tourist who visited caribbean island between 2010 and 2017 also give information about visitor's data of staying in this island.
We saw that around 0.25 millions of visitor staying on cruise ship in 2010 which is the lowest number of visitors between 2010 and 2017. In 2017, around 2 millions of visitor are staying on cruise ship which was the highest number of visitors staying.
Many of them are staying on island, in 2010, around 0.75 million visitors are staying on island which is the lowest number of visitors while in 2017, highest visitors around 1.5 million are staying on island. graph also show that between 2013 and 2015, the ratio of visitors staying on island is constant.
Total number of visitors staying in island is 1 million in 2010 and in 2017, number of visitors is highest around 3.5 million.
allover graph differentiate the information of visitors either they are staying on cruise ship or staying on island.
AI examiner evaluation
| Criterion | Band |
|---|---|
| Task Achievement / Task Response | 6.0 |
| Coherence and Cohesion | 5.5 |
| Lexical Resource | 5.0 |
| Grammatical Range and Accuracy | 5.0 |
| Overall | 5.5 |
Task Achievement / Task Response: Band 6.0
You identify the main overall rise in total visitors, from about 1 million in 2010 to 3.5 million in 2017, and report useful extremes for both visitor groups. The statement that island-staying visitors remained stable from 2013 to 2015 is also accurate. However, the overview is limited: it does not clearly compare the two categories or highlight that cruise-ship numbers rose sharply while island-staying figures fluctuated only modestly. The claim that 0.25 million cruise visitors in 2010 was the lowest is inaccurate, since the series also falls to about 0.25 million in 2012. Your account is relevant and covers the chart, but some features are less fully selected and compared than others.
Coherence and Cohesion: Band 5.5
The response has a basic sequence: it discusses cruise-ship visitors, then island visitors, and finally the total. This makes the main categories identifiable, and phrases such as “while” help signal comparisons. However, the opening is not a clear overview, and the final sentence repeats the chart’s general purpose rather than summarising its main trends. Connections between details are sometimes mechanical, with several sentences beginning “In 2010” or “in 2017.” Paragraphing and progression could be clearer if you grouped the overview first, then compared the two visitor types and concluded with the total trend. Some references, such as “Many of them,” are also not immediately precise.
Lexical Resource: Band 5.0
You use relevant chart vocabulary, including “visitors,” “total number,” “highest,” “lowest,” and “constant,” so the reader can follow the subject. However, the range is limited and several word choices or collocations are noticeably inaccurate, such as “Below chart give the information,” “visitor’s data,” and “the ratio of visitors … is constant.” “Ratio” does not describe an unchanged number here, and “allover graph differentiate” is difficult to interpret. Repetition of “visitors” and “staying” also makes the description less precise. Aim for standard reporting phrases and vary verbs such as “rose,” “remained stable,” and “fluctuated” to describe the data more naturally.
Grammatical Range and Accuracy: Band 5.0
You attempt both simple statements and longer comparisons, for example, “in 2010 … which is the lowest … while in 2017…” This shows some effort to connect ideas, but the sentence structures are often awkward or incomplete, and errors recur in verb forms, agreement, articles, and plurals. Examples include “Below chart give,” “0.25 millions of visitor,” and “number of visitors is highest.” Tense use also shifts between “visited,” “are staying,” and “was,” although the chart describes figures across past years. These problems sometimes make the reader work to understand the intended meaning. Use a consistent past tense and check subject–verb agreement and singular/plural forms when revising.
See this exact question answered at other band scores. The same prompt compared across bands.
Browse more IELTS Writing model answers or get your own writing scored by the same AI examiner.