Band 5.5 IELTS Writing Task 1 Model Answer
Overall Band Score: 5.5 · Cambridge IELTS 15 · 2026-11-18
IELTS Writing Task 1 question
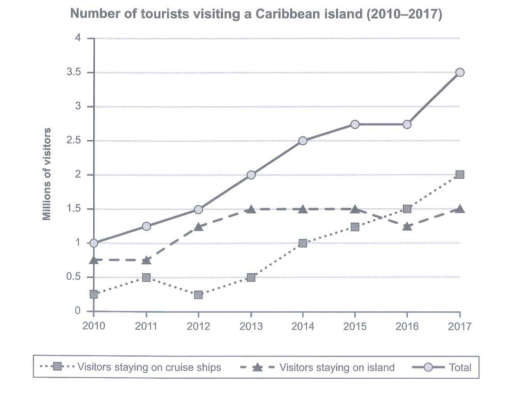
The graph below shows the number of tourists visiting a particular Caribbean island between 2010 and 2017.
Summarize the information by selecting and reporting the main features and make comparisons where relevant.
Student answer (Band 5.5)
The line graph illustrate the number of tourists visiting a particular Caribbean island from 2010 to 2017. Visitors was count in millions.
In 2010, The visitors who are staying on Caribbean island was about 0.75 million till 2011 but then increased and in 2013 about1.5 million visitors stay on island which was then remain constant till 2015 and then decreased from 2015 to 2016 and about 1.25 million visitors was left which stay on island and then from 2016 they again rise up and 1.5 million stay on island.
In 2010, about 0.25 million visitors was like to stay on cruise ships which was increased and in 2011 0.5 millions visitors stayed on cruise ships but from 2011 then decreased and 0.25 million stay on different cruise ships but from 2012 the number of vistors increased rapidly till 2017. And in 2017, 2 milliions visitors liked to spend their time on cruise ships.
Total number of visitors from 2010 increased in every year till 2015 which was about 2.75 million visitors. from 2015 to 2016 visitors was stabled and then from 2016 they rose up and in 2017 total visitors was 3.5 million.
AI examiner evaluation
| Criterion | Band |
|---|---|
| Task Achievement / Task Response | 6.0 |
| Coherence and Cohesion | 5.5 |
| Lexical Resource | 5.0 |
| Grammatical Range and Accuracy | 5.0 |
| Overall | 5.5 |
Task Achievement / Task Response: Band 6.0
You cover all three series and report the main overall rise in total visitors, including the plateau at about 2.75 million in 2015–16 and the peak of 3.5 million in 2017. The cruise-ship figures are also broadly accurate, and you note that island stays levelled off before dipping and recovering. However, there is no clear overview that brings these main patterns together, and some details are unclear or incomplete: for example, the island total had already risen to about 1.25 million in 2012, while the cruise-ship series fluctuated before its sustained rise. A concise overview comparing the strong cruise-ship growth with the relatively stable island figures would make the key features clearer and more fully developed.
Coherence and Cohesion: Band 5.5
The response is arranged in a generally understandable order: it discusses island visitors, cruise-ship visitors, and then the total. This gives the reader a basic route through the graph. However, the paragraphs mostly list year-by-year changes rather than building a clear progression from an overview to selected comparisons. Linking words such as “but then,” “and then,” and “from 2016” are repeated, and some references are difficult to follow, as in “from 2011 then decreased” and “from 2016 they rose up.” Use a separate overview followed by grouped comparisons, and vary linking expressions to show contrast and sequence more precisely. This would make the organisation more coherent and less repetitive.
Lexical Resource: Band 5.0
You use relevant basic vocabulary, including “increased,” “decreased,” “constant,” and “total number of visitors,” so the main trends can usually be understood. However, the range is limited and several choices are unnatural or imprecise for describing a graph. Phrases such as “liked to stay,” “spend their time,” “rose up,” and “visitors was stabled” sound conversational or do not express the data accurately. There are also noticeable spelling and form errors, including “vistors” and “milliions.” Aim for concise reporting language such as “the number of visitors staying on cruise ships,” “remained stable,” and “rose to.” More precise trend vocabulary would improve clarity and control.
Grammatical Range and Accuracy: Band 5.0
You attempt some longer sentences to describe changes over time, and the reader can generally identify the intended trends. However, sentence structures are limited and the longer sentences often contain several grammatical problems. Subject–verb agreement is inconsistent in examples such as “The line graph illustrate” and “Visitors was count”; tense and verb forms are also faulty in “which was then remain constant.” Articles, plurals, and punctuation need attention, as in “about1.5 million” and the lower-case sentence beginning “from 2015.” These errors sometimes make relationships between dates and figures harder to follow. Practise accurate past-tense reporting and break long sequences into shorter sentences, while retaining some correctly formed complex sentences.
See this exact question answered at other band scores. The same prompt compared across bands.
Browse more IELTS Writing model answers or get your own writing scored by the same AI examiner.