Band 5.0 IELTS Writing Task 1 Model Answer
Overall Band Score: 5.0 · Cambridge IELTS 15 · 2026-11-21
IELTS Writing Task 1 question
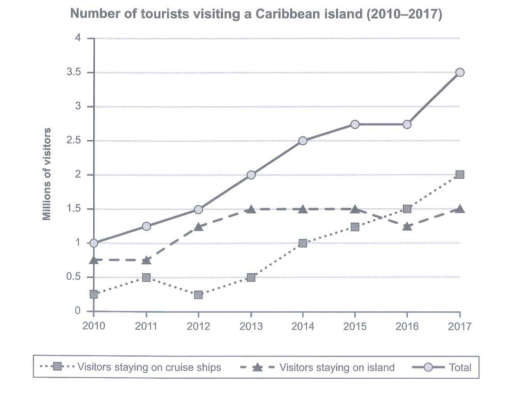
The graph below shows the number of tourists visiting a particular Caribbean island between 2010 and 2017.
Summarize the information by selecting and reporting the main features and make comparisons where relevant.
Student answer (Band 5.0)
The line graph illustrates the number of tourists visiting a particular Caribbean island from 2010 to 2017.
Overall, The total tourists in these years had increaded significantly. the visitors staying on islands had shows fluctuations and to 2012 the tourists were not preaped the staying on islands. however, after that year tourist took the intrest and has figure rose up.
Looking at the details, when the tourist visited to Caribbean Islands. the most tourits choose stying on island in 2010 were around 0.7 million for one year. many visiotor took the intrest in island. from 2011 to 2015 figure was reached to peak point at 1.5 million in 2017 . the visitors who took the intrest were around 0.25 in 2010 to 2012 figure was fluctuated but in 2012 tourist became declined after that the tourists were tooking the intrest on stying on cruise had increased significantly and overtook in between the 2015 and 2016 and then reached to peak point at 2 million. the total tourist were 1 millio over the time rose up and finally hitting at peak pon in 2017 at 3.5 MILLION.
AI examiner evaluation
| Criterion | Band |
|---|---|
| Task Achievement / Task Response | 5.5 |
| Coherence and Cohesion | 5.0 |
| Lexical Resource | 5.0 |
| Grammatical Range and Accuracy | 4.5 |
| Overall | 5.0 |
Task Achievement / Task Response: Band 5.5
You identify the chart’s subject and period, and you report the broad rise in total visitors, including the final figure of 3.5 million. You also notice that cruise-ship visitors increased substantially and eventually exceeded those staying on the island. However, several details are unclear or inaccurate: island-staying visitors did not rise to 1.5 million in 2017 from a peak then; they reached 1.5 million by 2013, remained there through 2015, dipped in 2016, and returned to 1.5 million in 2017. The claim that tourists were “not prepared” to stay on the island is unsupported. The overview also does not clearly compare the two categories or identify the overall pattern. Select key trends accurately and summarise them directly.
Coherence and Cohesion: Band 5.0
There is a basic paragraph structure, with an introduction, an overview and a detail paragraph, and the response generally follows the chart’s time period. However, progression within the detail paragraph is difficult to follow because several trends are combined in one long sequence. For example, the account moves from island visitors to cruise visitors and then to totals without clear separation, while phrases such as “after that year” and “the visitors who took the intrest” have unclear references. Linking words such as “however” and “after that” are attempted, but do not consistently clarify the relationships between ideas. Organise the body by visitor category or by stages over time, and use shorter sentences with explicit references.
Lexical Resource: Band 5.0
You use some task-relevant vocabulary, including “fluctuations,” “overtook,” “increased significantly” and “peak point,” showing an attempt to describe trends rather than simply list figures. However, the range is limited and several word choices or collocations make the meaning difficult to understand, such as “tourists were not preaped the staying on islands” and “took the intrest.” Spelling errors, including “increaded,” “tourits” and “pon,” also reduce clarity. Aim for precise, conventional chart language and avoid repeating “took the interest.” For example, describe figures as “rose,” “remained stable,” “fell slightly” or “reached a peak,” and check spelling carefully before submitting.
Grammatical Range and Accuracy: Band 4.5
The response attempts both simple and more extended sentences, but control is inconsistent, and errors often make relationships between ideas hard to follow. Examples include “the visitors staying on islands had shows fluctuations,” “from 2011 to 2015 figure was reached,” and “the total tourist were 1 millio over the time rose up.” These show problems with verb forms, agreement, articles and sentence construction. Some sentences also run together, as in the long account of cruise-ship visitors, making it difficult to identify the main clause. Use a reliable pattern such as “The number of visitors staying on the island rose from X to Y,” and separate each trend into a complete sentence. Check subject–verb agreement and keep verb tenses consistent.
See this exact question answered at other band scores. The same prompt compared across bands.
Browse more IELTS Writing model answers or get your own writing scored by the same AI examiner.