Band 5.5 IELTS Writing Task 1 Model Answer
Overall Band Score: 5.5 · Cambridge IELTS 15 · 2026-11-05
IELTS Writing Task 1 question
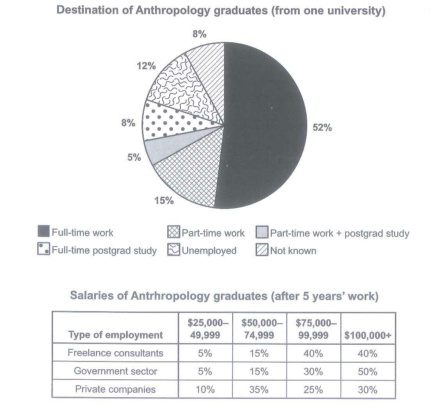
The chart below shows what Anthropology graduates from one university did after finishing their undergraduate degree course. The table shows the salaries of the anthropologists in work after five years.
Summarize the information by selecting and reporting the main features and make comparison where relevant.
Student answer (Band 5.5)
to begin with, in this diagram shows piur chat and table contect, pie charts show the the percentage fo students who passed from the university, in the above pie chart the biggest number of student were employed full time work as 52percent and the 5 present student were doing the postgrad study and doing paorttime job.the percentage of unemployed and part time work, were alsmot the same shown in the pie chat that is between12 to 15%.Whereas, 8% of student took part in fulltime postgraduate study and 8% remians not know.
Below this the table chart shows the amount of salaries of anthropolgy graduates after working 5 years.There is big drastic change in government sector from 5% to 50% in 5 years, whereas in private companies, the amount of wages were increased in first half and then decreased at the end.On the otherhad in freelance consultation, the amount of salary incereaes in first half and the stayed the same in the following years.
Overall, both the diagrams shows the percentage of students who graduate from university ,about there salaries and what occupation they are doing.
AI examiner evaluation
| Criterion | Band |
|---|---|
| Task Achievement / Task Response | 5.0 |
| Coherence and Cohesion | 6.0 |
| Lexical Resource | 5.0 |
| Grammatical Range and Accuracy | 5.0 |
| Overall | 5.5 |
Task Achievement / Task Response: Band 5.0
You identify several key figures accurately, including 52% in full-time work, 5% combining part-time work with postgraduate study, and the two 8% categories. You also attempt to summarise the salary table, but some comparisons are unclear or inaccurate: the government figures are salary-band shares, not a change “in 5 years,” and the freelance figures do not simply stay the same after the first half. The overview is also too general, saying only that the diagrams show salaries and occupations, rather than highlighting the main patterns—for example, full-time work is the largest destination, while government employees have the highest share in the top salary band. More precise selection and explanation of the table’s figures would make the response address the task more fully.
Coherence and Cohesion: Band 6.0
The response has a recognisable overall arrangement: it discusses the pie chart first, then the salary table, and uses a final paragraph to attempt an overview. This helps the reader follow the broad topic. However, progression within paragraphs is sometimes difficult to track, particularly in the salary section, where “in first half” and “at the end” do not clearly identify salary bands. Linking expressions such as “Whereas” and “On the other hand” are attempted, but their relationships are not always clear or appropriate. The final overview repeats general information rather than drawing the two main patterns together. Use clearer topic sentences and refer explicitly to categories and salary ranges to strengthen cohesion.
Lexical Resource: Band 5.0
You use some relevant task vocabulary, including “percentage,” “unemployed,” “postgraduate study,” “government sector,” and “private companies.” These terms show an attempt to describe the visual data. However, the range is limited and several word choices or collocations make the meaning unclear, such as “the amount of salaries,” “big drastic change,” and “the percentage of students who passed from the university.” There are also noticeable spelling errors, including “anthropolgy,” “incereaes,” and “remians,” which reduce clarity. Aim for precise chart language such as “proportion,” “salary band,” and “accounted for,” and check spelling and word forms carefully.
Grammatical Range and Accuracy: Band 5.0
You attempt to combine ideas using clauses and contrast markers, for example, “Whereas, 8% of student took part…” and “in private companies, the amount of wages were increased…”. However, complex sentence attempts are often faulty, and errors in sentence structure, agreement, articles, and tense occur frequently enough to make some statements difficult to interpret. Examples include “in this diagram shows,” “the biggest number of student were,” and “both the diagrams shows.” Several sentences also lack clear boundaries or use punctuation inconsistently. Practise building accurate simple sentences first, then add subordinate clauses; check subject–verb agreement and use past tense consistently when describing the reported outcomes.
See this exact question answered at other band scores. The same prompt compared across bands.
Browse more IELTS Writing model answers or get your own writing scored by the same AI examiner.