Band 6.0 IELTS Writing Task 1 Model Answer
Overall Band Score: 6.0 · Cambridge IELTS 15 · 2026-11-06
IELTS Writing Task 1 question
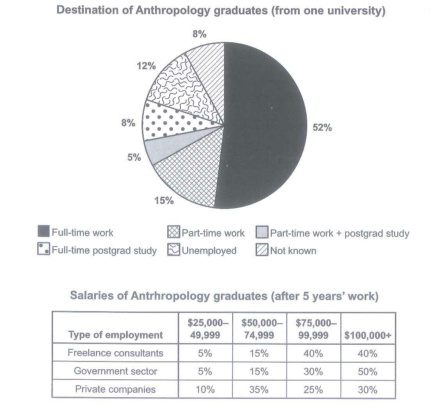
The chart below shows what Anthropology graduates from one university did after finishing their undergraduate degree course. The table shows the salaries of the anthropologists in work after five years.
Summarize the information by selecting and reporting the main features and make comparison where relevant.
Student answer (Band 6.0)
The chart illustrates the distination of Anthropology graduates after completing their degree. While, the table highlights the anthropologist's salaries in work after five years.
Overall, majority of students get full-time work, followed by part-time work. in addition, some pupils are unemployed. While, government sector are paid more salaries to Anthropology graduates than freelance consultants and private companies.
Looking closely to pie chart, 52 percent of graduates get full-time job and 15 percent part-time work. In stark contrast, the figure shows that 8 percent of students join university for postgraduates studies. Small proportion of students, at 5 percent, decided to continous the postgraduates studies with work. Conversely, 12 percent of Anthropology graduates faced unemployment and 8 percent are unknown.
Turning to the salaries of Anthropology graduates, 50 percent higher salaries are paid to Anthropology graduates in government sectors than freelance consultants and private companies that give 40 percent and 25 percent respectively, which depicts that private companies give lower pay.
AI examiner evaluation
| Criterion | Band |
|---|---|
| Task Achievement / Task Response | 6.0 |
| Coherence and Cohesion | 6.0 |
| Lexical Resource | 5.5 |
| Grammatical Range and Accuracy | 5.5 |
| Overall | 6.0 |
Task Achievement / Task Response: Band 6.0
You cover both visuals and include several accurate figures, including 52% in full-time work, 15% in part-time work, and the 12% unemployed. The overview also identifies full-time work as the largest destination. However, the salary discussion is incomplete and partly misinterprets the table: 50% in government employment earned $100,000 or more, but this is not a single overall salary comparison with the other sectors. The table shows distributions across four salary bands, and the response omits most of those bands. Also, 8% continued with full-time postgraduate study, rather than simply “join university.” To strengthen the report, summarise the main salary pattern across the bands and make comparisons that accurately reflect the table’s categories.
Coherence and Cohesion: Band 6.0
The response has a recognisable structure: an introduction, an overview, a paragraph on graduate destinations, and a final paragraph on salaries. This gives the reader a coherent overall route through the two visuals. Some linking is effective, such as “Turning to” to introduce the table, but other transitions are mechanical or awkward. For example, “While” begins a sentence fragment in the overview, and “Conversely” does not express a clear contrast in the sentence about unemployment and unknown destinations. The salary paragraph also combines several comparisons in one long sentence, making the relationships harder to follow. Use complete, clearly separated sentences and organise the table information by salary band or employment sector to improve progression and cohesion.
Lexical Resource: Band 5.5
You use some task-relevant vocabulary, including “destination,” “graduates,” “unemployment,” and “salaries,” and phrases such as “in stark contrast” show an attempt to vary your language. However, several word choices and collocations are inaccurate or unnatural, including “distination,” “students” for graduates, “get full-time job,” and “higher salaries are paid … than.” “Pupils” is also unsuitable for university graduates, while “unknown” is less precise than describing their destination as not known. These choices do not prevent the main message from being understood, but they reduce precision and naturalness. Build a more reliable range of chart-reporting phrases, especially for describing proportions, employment categories, and salary bands, and check spelling carefully.
Grammatical Range and Accuracy: Band 5.5
You attempt both simple and more complex sentence forms, including a comparison introduced by “While” and a longer sentence beginning “Turning to the salaries.” The main information is generally understandable, but some grammatical errors remain. “While, the table highlights” is not a complete sentence, and “in addition” incorrectly begins a sentence with a lowercase letter. There are also agreement and article problems in “majority of students get” and “government sector are paid,” as well as inconsistent tense in “12 percent … faced unemployment and 8 percent are unknown.” The final sentence is overloaded, which makes its grammatical relationships unclear. Use complete sentences, check subject–verb agreement, and keep comparisons in shorter structures; this will make your range more controlled and accurate.
See this exact question answered at other band scores. The same prompt compared across bands.
Browse more IELTS Writing model answers or get your own writing scored by the same AI examiner.