Band 5.5 IELTS Writing Task 1 Model Answer
Overall Band Score: 5.5 · Cambridge IELTS 15 · 2026-11-06
IELTS Writing Task 1 question
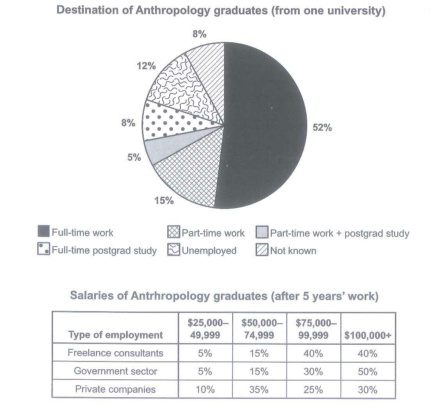
The chart below shows what Anthropology graduates from one university did after finishing their undergraduate degree course. The table shows the salaries of the anthropologists in work after five years.
Summarize the information by selecting and reporting the main features and make comparison where relevant.
Student answer (Band 5.5)
The pie chart illustrates the information what anthropology students from one institute did after finishing their undergraduate degree course, while the table provides data about salaries of anthropologists in work after five years.
Overall, it is clear that Full-time work accounted for the largest proportion, whereas Part-time work and postgrad study represented the smallest proprtion. Furthermore, the table shows that private companies have offered highest salaries, while freelance consultants and Government sector remained almost same.
According to the pie chart, Full-time work has highest figure, at 52% and it's contanined more than half of figure. Moreover, part-time work made up 15% and the ratio of Unemployed graduates at 12%. The figure of Full-time postgrad study and not known have same position, at 8%. In contrat, Part-time work and postgrad study has lowest figure in this trend.
Looking at the table, it can be seen that Private companies offered very high salaries after 5 year's work, $[redacted phone]9 at 35% and $[redacted phone]+ at 30%. In contrary, Freelance consultants and Government sector have showed low figure, such as $[redacted phone]0 at 5% and $[redacted phone]9 at 15%.
AI examiner evaluation
| Criterion | Band |
|---|---|
| Task Achievement / Task Response | 5.5 |
| Coherence and Cohesion | 5.5 |
| Lexical Resource | 5.5 |
| Grammatical Range and Accuracy | 5.5 |
| Overall | 5.5 |
Task Achievement / Task Response: Band 5.5
You identify the main destination clearly: full-time work is the largest category at 52%, and you note that part-time work combined with postgraduate study is the smallest. You also include several other accurate figures. However, the overview of the salary table is not supported by the data: private companies do not offer the highest salaries overall, since 50% of government-sector employees and 40% of freelance consultants earn $100,000 or more, compared with 30% in private companies. The table description then gives only two salary bands for private companies and two low-band figures for the other sectors, leaving the main contrasts underdeveloped. Report the distribution across all three employment types and make the overview reflect the strongest comparisons.
Coherence and Cohesion: Band 5.5
The response has a recognisable structure, with an introduction, an overview, and separate paragraphs for the pie chart and table. This helps the reader distinguish the two visuals, and transitions such as “According to the pie chart” and “Looking at the table” make the topic shifts clear. However, progression within the data paragraphs is limited: the pie-chart paragraph lists figures without grouping them into meaningful comparisons, while the table paragraph selects only a few values and does not systematically compare sectors or salary bands. Some linking phrases, including “In contrary,” are also used inaccurately, which weakens the connection between ideas. Organise each paragraph around a clear comparison and use linking expressions only where their meaning fits.
Lexical Resource: Band 5.5
You use relevant task vocabulary, including “accounted for,” “proportion,” “represented,” and “salary,” and the reader can generally understand the intended comparisons. However, the range is limited and several word-choice, collocation, and spelling problems reduce precision. For example, “contained more than half of figure” is not a natural way to describe the 52% share, and “same position” is unclear when referring to equal proportions. There are also misspellings such as “proprtion,” “contanined,” and “contrat.” Aim for accurate chart language and check spelling carefully; precise phrases such as “made up just over half” and “were equal at 8%” would communicate the data more naturally.
Grammatical Range and Accuracy: Band 5.5
You attempt a mixture of simple statements and longer sentences, including a contrast introduced by “while” and an overview beginning “Overall, it is clear that…”. Meaning is usually recoverable, but errors in sentence construction and grammatical patterns recur. For instance, “the information what anthropology students… did” uses an incorrect clause pattern, and “Full-time work has highest figure” is missing an article. In “the ratio of Unemployed graduates at 12%,” the sentence lacks a suitable verb, while “Part-time work and postgrad study has lowest figure” has a subject–verb agreement problem. Use complete, controlled sentence patterns, check articles and agreement, and vary structures only when you can maintain accuracy.
See this exact question answered at other band scores. The same prompt compared across bands.
Browse more IELTS Writing model answers or get your own writing scored by the same AI examiner.