Band 4.5 IELTS Writing Task 1 Model Answer
Overall Band Score: 4.5 · Cambridge IELTS 15 · 2026-11-10
IELTS Writing Task 1 question
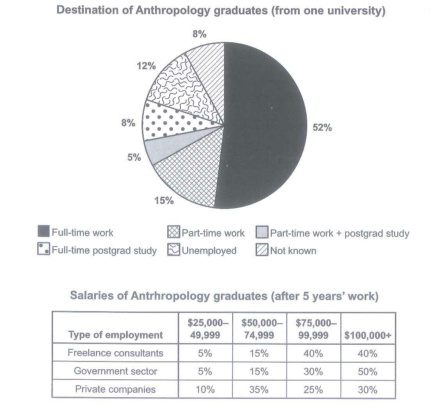
The chart below shows what Anthropology graduates from one university did after finishing their undergraduate degree course. The table shows the salaries of the anthropologists in work after five years.
Summarize the information by selecting and reporting the main features and make comparison where relevant.
Student answer (Band 4.5)
The given bar chart elucidates information about Destination of Anthropology graduates from one university . The chart compares the different categories and present the data in number or percentage . Overall it is clear that there are noticeable differences among the categories shown in the chart . Some categories show some fluctuations by following increment as well as decrement whereas for some cases they remain stable . According to the chart the first part is full time work that highest percentage is 52 . The next step is part time work that percentage is 15 . the next step is postgrad study that percentage is 5 this is normal . The next step is full time study that percentage is 8 . The next step is Unemployed this percentage is 12 . The next and last step is not known this percentage is 8 . This show a clear comparison among the activities . Furthermore all provided data suggests that there is no stability in the all activities .
AI examiner evaluation
| Criterion | Band |
|---|---|
| Task Achievement / Task Response | 3.5 |
| Coherence and Cohesion | 4.5 |
| Lexical Resource | 5.5 |
| Grammatical Range and Accuracy | 5.0 |
| Overall | 4.5 |
Task Achievement / Task Response: Band 3.5
The response identifies several correct figures for the graduate destinations, including full-time work at 52%, part-time work at 15%, and unemployment at 12%. However, it does not summarise the full task: the salary table, which is a major part of the visual, is entirely omitted. The overview is also vague and partly inaccurate. Claims that categories show “fluctuations” or “remain stable” do not describe this one-time distribution, and saying there is “no stability” is not a meaningful comparison. The response mainly lists destination figures without highlighting the dominant outcome or comparing the salary patterns across employment types. To improve, cover both visuals and select key contrasts, such as the high proportions earning $100,000 or more in government and freelance work.
Coherence and Cohesion: Band 4.5
There is a basic sequence: the response introduces the chart, gives a general statement, and then lists destination categories. Linking phrases such as “The next step” and “Furthermore” help signal movement between points. However, the progression is mechanical and repetitive, and the response does not separate an overview from detailed reporting in a clear paragraph structure. The repeated “next step” wording also makes the categories sound like stages, although they are separate destinations. The final sentence repeats the earlier generalisation rather than drawing the information together. Organise the response into an introduction, a concise overview, and focused detail paragraphs, using comparisons and clear references to connect related figures.
Lexical Resource: Band 5.5
The response uses some task-related vocabulary, including “percentage,” “categories,” “full time work,” and “postgrad study,” so the main subject is generally understandable. There are also attempts at more formal wording, such as “elucidates” and “noticeable differences.” However, several choices are unnatural or imprecise: “the first part,” “the next step,” and “this is normal” do not accurately describe chart categories or data. “Fluctuations” and “stability” are also unsuitable for a chart showing proportions at one point. Repetition of “percentage” and “next” limits flexibility. Use precise reporting language such as “accounted for,” “was the largest share,” and “by contrast,” and name the salary bands when discussing the table.
Grammatical Range and Accuracy: Band 5.0
The response relies mainly on short, simple statements, with limited evidence of varied sentence structures. Some meaning remains clear, but errors occur in sentence formation and agreement. For example, “the first part is full time work that highest percentage is 52” is not a complete, well-formed comparison; it needs a structure such as “Full-time work was the largest category, at 52%.” In “This show a clear comparison,” the subject and verb do not agree, and several sentences begin with lowercase “the” after a full stop. Spacing before punctuation is also inconsistent. Practise accurate comparative sentences and combine related figures using controlled clauses, while checking sentence boundaries, capitalization, and agreement.
See this exact question answered at other band scores. The same prompt compared across bands.
Browse more IELTS Writing model answers or get your own writing scored by the same AI examiner.