Band 5.0 IELTS Writing Task 1 Model Answer
Overall Band Score: 5.0 · Cambridge IELTS 15 · 2026-11-10
IELTS Writing Task 1 question
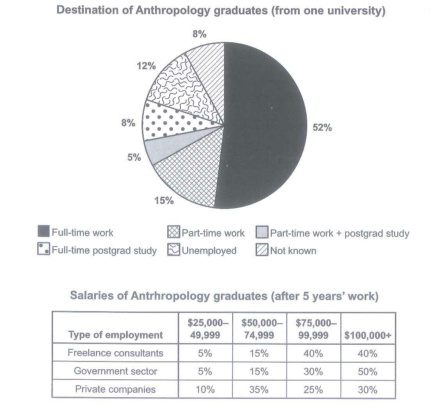
The chart below shows what Anthropology graduates from one university did after finishing their undergraduate degree course. The table shows the salaries of the anthropologists in work after five years.
Summarize the information by selecting and reporting the main features and make comparison where relevant.
Student answer (Band 5.0)
The pie chart compares the Anthropology graduates of a university that after completing their undergraduate degree course what have they done while the table show the salaries of anthropologists that are in work for five years.
Overall, full time work has a greater proportion in the piechart and the lowest proportion is part time work and postgraduate study while in the table the salaries of government sector have a greater proportion and the significance of private companies has a lower proportion.
By analyzing the piechart the proportion of full time work is greater which is 52%. followed by part time work which is 15% and also unemployed which is 12% while full time postgraduate study and not known has the similar proportion of 8%.However, the lowest proportion is part time work and postgraduate study which is 5%.
Looking at the table, the proporto of government sector has the highest
AI examiner evaluation
| Criterion | Band |
|---|---|
| Task Achievement / Task Response | 3.5 |
| Coherence and Cohesion | 5.0 |
| Lexical Resource | 5.5 |
| Grammatical Range and Accuracy | 5.0 |
| Overall | 5.0 |
Task Achievement / Task Response: Band 3.5
You identify the main destination clearly: full-time work is the largest category at 52%, and part-time work combined with postgraduate study is the smallest at 5%. You also report several other pie-chart figures accurately. However, the response only partially covers the task: the table discussion stops at “the highest” and gives no salary figures or comparisons, so a major part of the visual is missing. The overview also misinterprets the table: government employment does not have the greatest proportion overall, and the data show salary distributions within each employment type, not the proportions of graduates in those sectors. The response is also one word below the required minimum. To improve, complete the table summary and compare its salary bands accurately.
Coherence and Cohesion: Band 5.0
The response has a recognisable structure, with an introduction, an overview, a paragraph on the pie chart and a final paragraph beginning the table discussion. This gives the reader some organisation, and phrases such as “Overall,” “By analyzing,” and “Looking at the table” signal transitions. However, progression is limited because the final paragraph ends abruptly after “the highest,” leaving the table unreported and the response incomplete. Some linking is mechanical or repetitive, particularly the repeated use of “proportion” and “which.” The overview also combines claims about the two visuals without making the table comparison clear. Develop the final paragraph, group related figures, and use more precise links to show contrasts between categories.
Lexical Resource: Band 5.5
You use enough task-related vocabulary to communicate the main pie-chart information, including “full-time work,” “unemployed,” “postgraduate study,” and “proportion.” There is some variation in signposting, such as “Overall” and “Looking at the table.” However, word choice and collocation are often awkward or repetitive: “the significance of private companies has a lower proportion” is unclear, and “the proportion of government sector has the highest” is incomplete. “Piechart” is also written inconsistently as one word, while “proporto” appears to be a spelling error. Aim for precise terms such as “share,” “salary band,” and “employment category,” and describe the table as the percentage of workers in each salary range rather than the “significance” of a sector.
Grammatical Range and Accuracy: Band 5.0
You attempt both simple and more extended sentence forms, including the opening clause beginning “after completing their undergraduate degree course” and the overview introduced by “Overall.” However, complex structures are often faulty, and errors sometimes make relationships difficult to follow. For example, “compares the Anthropology graduates … that after completing … what have they done” has an incorrect clause structure, while “the table show” has subject–verb disagreement. There are also sentence-boundary and punctuation problems, such as the full stop before “followed” and the missing space after “8%.However.” The final sentence is incomplete. Use a direct structure such as “The chart shows what graduates did after completing their degrees,” check agreement and punctuation, and ensure every sentence is complete.
See this exact question answered at other band scores. The same prompt compared across bands.
Browse more IELTS Writing model answers or get your own writing scored by the same AI examiner.