Band 5.5 IELTS Writing Task 1 Model Answer
Overall Band Score: 5.5 · Cambridge IELTS 15 · 2026-11-10
IELTS Writing Task 1 question
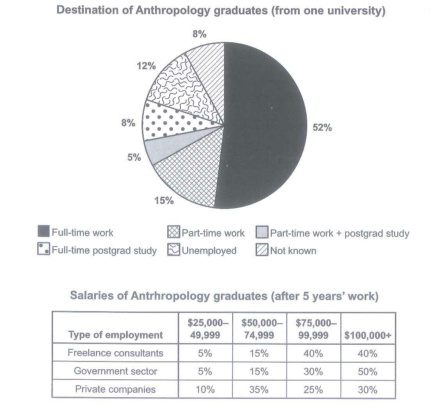
The chart below shows what Anthropology graduates from one university did after finishing their undergraduate degree course. The table shows the salaries of the anthropologists in work after five years.
Summarize the information by selecting and reporting the main features and make comparison where relevant.
Student answer (Band 5.5)
The pie chart illustrates the six destination of the Anthropology graduates from one university after finishing their bachelor's degree.However, the table illustrates the anthropologist's salaries in work five years ahead.
On average, the 52% of the anthropologist students has a full-time work,while the least 5% of the univeristy students are doing part-time work + postgrad studies.However, the students doing full-time postgrad study and not know are 8%.Although, students who are unemployed and doing part-time work are 12% and 15% respectively.
On the other hand, 50% of government sector employees are more likely to earn around $100,000+ after five years meanwhile 30%, 15%, 5% of employes earn about $75,000-99,99, $50,000-74,999, $25,000-49,999.Employees working in a private sector are earning the least amount around 40% of the employees earn $100,000+ after five years, while 30%,15%,5% are more likely to earn around $75,000-99,999, $50,000-74,999, $25,000-49,999.Consquently, free lance consultants are at he second highest employees roughly 40% of them earn $100,000+ and 75,000-99,999 respectively rest 15% and 5% earns approximately $50,000-74,999 and $25,000-49,999.
In conclusion, the highest number of anthropology students works as a full-time worker after graduation.Meanwhile, the government sector employees has the highest salaries after five year's of work.
AI examiner evaluation
| Criterion | Band |
|---|---|
| Task Achievement / Task Response | 5.5 |
| Coherence and Cohesion | 6.0 |
| Lexical Resource | 5.5 |
| Grammatical Range and Accuracy | 5.0 |
| Overall | 5.5 |
Task Achievement / Task Response: Band 5.5
You cover both visuals and identify the main destination, full-time work, as the largest category, while noting that government employees most often reach the top salary band. Several figures are reported accurately, including 52% in full-time work and the government-sector salary distribution. However, the overview is limited, and some comparisons are unclear or inaccurate: private-company employees earning $100,000+ are 30%, not 40%, and the lowest salary group there is 10%, not 5%. The table’s freelance figures are mostly correct, but “second highest employees” does not clearly describe the salary pattern. To strengthen the response, give a concise overview of the main contrasts and check each table figure against its column before comparing categories.
Coherence and Cohesion: Band 6.0
The response has a recognisable structure: an introduction, a paragraph on graduate destinations, a paragraph on salaries, and a concluding statement. This makes the two visuals easy to distinguish overall. However, progression within sentences is sometimes awkward, and linking words are not always used to show the intended relationship. For example, “However” introduces the table in the opening even though it is simply the second visual, while “Although” begins a sentence that is not completed as a concessive structure. The salary paragraph also packs several figures into long sentences, making comparisons harder to follow. Use clearer topic sentences and separate each employment sector’s figures into concise, parallel comparisons.
Lexical Resource: Band 5.5
You use relevant task vocabulary such as “destination,” “full-time postgrad study,” “government sector,” and “freelance consultants,” so the reader can generally understand the categories being described. There is also some attempt to vary wording with phrases such as “more likely to earn” and “highest salaries.” However, several choices are inaccurate or unnatural, including “anthropologist students,” “the least 5%,” “free lance,” and “second highest employees.” Spelling errors such as “univeristy,” “employes,” and “Consquently” also reduce precision. Aim for standard chart-reporting collocations, such as “accounted for,” “the smallest proportion,” and “employees in private companies,” and check spelling carefully.
Grammatical Range and Accuracy: Band 5.0
You attempt both simple and more complex sentences, including comparisons linked with “while” and “meanwhile.” However, control is inconsistent, and errors in agreement, articles, sentence boundaries, and punctuation sometimes make the writing difficult to read. Examples include “the 52% … has a full-time work,” where the subject and verb do not agree, and “the government sector employees has,” which has the same problem. Several sentences run together without spaces after full stops, and “Although, students who are unemployed…” is not a complete, correctly formed concessive sentence. Practise accurate subject–verb agreement and use shorter sentences when listing data; then add complex clauses only when their structure is secure.
See this exact question answered at other band scores. The same prompt compared across bands.
Browse more IELTS Writing model answers or get your own writing scored by the same AI examiner.