Band 5.0 IELTS Writing Task 1 Model Answer
Overall Band Score: 5.0 · Cambridge IELTS 15 · 2026-11-11
IELTS Writing Task 1 question
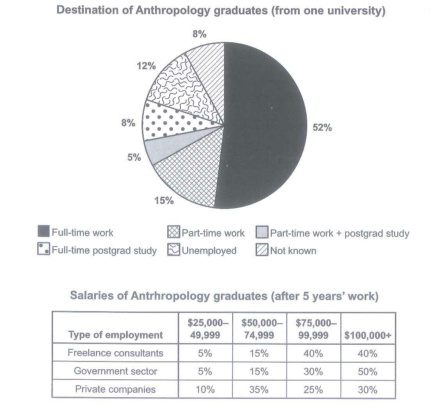
The chart below shows what Anthropology graduates from one university did after finishing their undergraduate degree course. The table shows the salaries of the anthropologists in work after five years.
Summarize the information by selecting and reporting the main features and make comparison where relevant.
Student answer (Band 5.0)
The pie chart illustrates the anthropology graduate from one university did after finishing their undergraduate degree course. The table depicts the salaries of the anthropologists in work after five years.
Overall, in chart, full-time worker had the largest group and part-time work and study had the lowest group. In table, government sectors had more salaries after five years work.
Acording to pie chart, full-time work had 52% and it iwa the largest group while part-time work accounted 15%. In contrast, unemployment accounted 12%. Moreover, postgrad study and unknown had same shared of 8%. Furthermore, part-time work and study had shared of 5% and it was the lowest group.
AI examiner evaluation
| Criterion | Band |
|---|---|
| Task Achievement / Task Response | 3.5 |
| Coherence and Cohesion | 5.0 |
| Lexical Resource | 5.0 |
| Grammatical Range and Accuracy | 5.5 |
| Overall | 5.0 |
Task Achievement / Task Response: Band 3.5
You identify the main destination, correctly reporting that full-time work was the largest category at 52%, and you include several other accurate figures, such as 15% for part-time work and 12% for unemployment. However, the response is substantially incomplete: it does not describe the salary table with any figures or comparisons, and the overview claim that government-sector salaries were higher is too vague to convey the salary distribution. The chart’s 5% category is also described imprecisely as “part-time work and study”; it refers specifically to part-time work plus postgraduate study. The response contains 86 words, below the required 150, which limits coverage and development. Include a clear overview and compare the salary bands across employment types.
Coherence and Cohesion: Band 5.0
The response has a basic, recognisable structure: an introduction, an overview, and a paragraph giving chart details. This helps the reader distinguish the general summary from supporting figures. You also use linking expressions such as “Overall,” “In contrast,” and “Moreover.” However, progression is limited because the salary table is mentioned only in the overview and is not developed in a separate section. Some linking is mechanical, with several sentences beginning “Moreover” or “Furthermore,” and the relationship between the categories in “postgrad study and unknown” is not clearly expressed. Organise the response into a chart paragraph and a table paragraph, and use comparisons to connect related figures rather than relying mainly on a list of connectors.
Lexical Resource: Band 5.0
You use relevant task vocabulary, including “full-time work,” “unemployment,” “postgrad study,” and “accounted,” so the reader can understand the general subject. There is some variation in how you refer to the visual, using “pie chart” and “table.” However, the range is limited and several word choices or collocations are inaccurate or awkward, such as “largest group,” “same shared of 8%,” and “government sectors had more salaries.” Spelling errors, including “Acording” and “iwa,” also reduce accuracy. Aim for precise reporting language such as “accounted for,” “the same proportion,” and “the highest salary band,” and use the table’s employment categories accurately.
Grammatical Range and Accuracy: Band 5.5
You produce several understandable simple sentences and attempt a range of structures, including a contrast clause in “while part-time work accounted 15%” and a sentence beginning “Moreover.” The main information is generally recoverable despite grammatical problems. However, sentence patterns are repetitive, and errors occur in articles, agreement, and sentence construction. For example, “The pie chart illustrates the anthropology graduate … did” is missing a grammatical link such as “what,” while “in chart” needs an article, and “full-time worker had” does not agree naturally with the plural category. The phrase “accounted 15%” also needs the preposition “for.” Practise accurate comparative sentences and check articles, verb forms, and prepositions when describing data.
See this exact question answered at other band scores. The same prompt compared across bands.
Browse more IELTS Writing model answers or get your own writing scored by the same AI examiner.