Band 5.0 IELTS Writing Task 1 Model Answer
Overall Band Score: 5.0 · Cambridge IELTS 15 · 2026-11-11
IELTS Writing Task 1 question
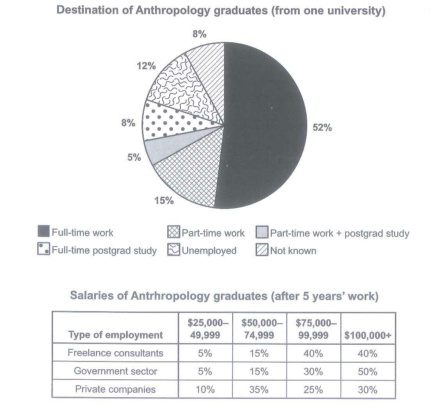
The chart below shows what Anthropology graduates from one university did after finishing their undergraduate degree course. The table shows the salaries of the anthropologists in work after five years.
Summarize the information by selecting and reporting the main features and make comparison where relevant.
Student answer (Band 5.0)
The chart below shows what Anthropology graduates from one university did after finishing their undergraduates degree course. The table shows the salaries of the anthropologists in work after five years.
Overall, the high percentage is 52% of full time work and low 5% is part time work and postgrad study in destination of Anthropology graduates.
According to the pie chart the chart below shows the high ratio is 52% in full-time work and low ratio is 5% in part time work and postgrad study. Next second big ratio is part time work is 15% and second low ratios are 8% in not known and same ratio is full time postgrad study. The last ratio is 12% in unemployed.
Acoording to the chart the chart shows the ratio of Salaries of Antrhropology in freelance consultants big percentage is 40% and second last Govemment sector is 50% and last big ratio in private companies is 35%.
AI examiner evaluation
| Criterion | Band |
|---|---|
| Task Achievement / Task Response | 4.0 |
| Coherence and Cohesion | 5.0 |
| Lexical Resource | 5.0 |
| Grammatical Range and Accuracy | 5.0 |
| Overall | 5.0 |
Task Achievement / Task Response: Band 4.0
You identify the main destination figure, full-time work at 52%, and mention several other categories, so the response is relevant to the chart. However, the overview is repetitive and does not summarise the salary table accurately: it calls 40% the largest freelance figure, overlooks that government employment has the highest top salary share at 50%, and describes 35% for private companies as the “last big ratio” without explaining its salary band. Several salary comparisons and the table’s income bands are missing, leaving the task only minimally covered. The response is also 25 words below the 150-word minimum; the 29 words copied from the prompt do not count. Add a concise overview and report key comparisons with their corresponding categories and salary ranges.
Coherence and Cohesion: Band 5.0
The response has a basic paragraph structure: an opening, a brief overview, and separate discussion of the destination chart and salary table. This gives the reader some organisation. However, progression is limited because the second paragraph repeats the overview almost word for word, and the salary information is compressed into one unclear sentence. Linking phrases such as “According to” and “Next” are used, but they do not establish clear relationships between the figures; “second last” is especially confusing. Group related figures into a logical sequence, avoid repeating the same point, and use comparisons such as “whereas” or “by contrast” to show how categories differ.
Lexical Resource: Band 5.0
You use relevant task vocabulary, including “full-time work,” “unemployed,” “freelance consultants,” and “private companies,” and the reader can generally identify the categories being discussed. However, the range is limited and several phrases are repetitive or imprecise, particularly “high ratio,” “big percentage,” and repeated uses of “chart shows.” There are also spelling errors, including “Acoording,” “Antrhropology,” and “Govemment,” which reduce accuracy. Use more precise terms for proportions and salary bands, and check spelling carefully. For example, describe a figure as the “largest share” and specify that a percentage falls within a particular income range.
Grammatical Range and Accuracy: Band 5.0
Most sentences are simple, and the response shows some control of basic sentence patterns, such as “The table shows the salaries…” and “The last ratio is 12% in unemployed.” However, the range is narrow, with little use of accurate complex structures, and errors occur frequently enough to make some statements awkward or unclear. For example, “the high percentage is 52% of full time work and low 5% is…” lacks parallel grammatical structure, while “the chart shows the ratio of Salaries of Antrhropology in freelance consultants big percentage is 40%” is difficult to parse. Practise forming complete comparison sentences, using articles and prepositions accurately, and punctuating longer sentences so each comparison is clear.
See this exact question answered at other band scores. The same prompt compared across bands.
Browse more IELTS Writing model answers or get your own writing scored by the same AI examiner.