Band 5.0 IELTS Writing Task 1 Model Answer
Overall Band Score: 5.0 · Cambridge IELTS 15 · 2026-11-11
IELTS Writing Task 1 question
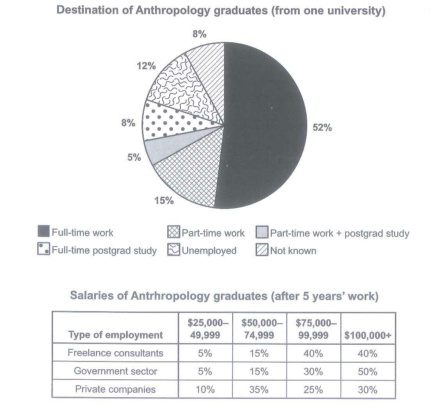
The chart below shows what Anthropology graduates from one university did after finishing their undergraduate degree course. The table shows the salaries of the anthropologists in work after five years.
Summarize the information by selecting and reporting the main features and make comparison where relevant.
Student answer (Band 5.0)
The chart illustrates information about Anthropology graduates did after finishing their undergraduate degree course. In addition, we discuss about destination of Anthropology graduates from one university. All statments in the fame of number and percentage.
Overall, Full time work in chart has highest percentage recoded thatr is 52%. Part time work fell to 15% only and Part time work + postgrad study percentage is 5% that is lowest value in the chart. Full time postgrad study percentage is 8% only and Unemployed percentage is to 12% and last Not known percentage is 8% according to the chart.
On the other hand, We discuss a table of salaries of Anthropology graduates after 5 years work. There are many changes recoded in the table. The value of salaries some time increased but some time decreased. There are many changes recoded. Furthermore, explination of freelance consultants, Government sector and private companies salaries started to $25,000 to $100,000+. There are some percentages recoded that is 5%, 15%, 40% and 40%. Next 5%, 15%, 30% and 50%. last 10% , 35%, 25% and 30% recoded according to the table.
AI examiner evaluation
| Criterion | Band |
|---|---|
| Task Achievement / Task Response | 4.5 |
| Coherence and Cohesion | 5.0 |
| Lexical Resource | 5.0 |
| Grammatical Range and Accuracy | 4.5 |
| Overall | 5.0 |
Task Achievement / Task Response: Band 4.5
You identify the two visuals and report the destination percentages accurately, including the leading share for full-time work and the small share combining part-time work with postgraduate study. However, the response mainly lists figures rather than selecting and comparing the key features. The salary section gives the figures in order but does not clearly connect each set to its employment type or explain the main pattern—for example, that government employees most often earn $100,000 or more, while private-company employees are more concentrated in the $50,000–74,999 range. The statement that salaries “sometimes increased but sometimes decreased” is not supported by this table, which compares salary bands rather than changes over time. A clearer overview and explicit comparisons would make the report more complete.
Coherence and Cohesion: Band 5.0
The response has a basic structure: an introduction, a paragraph about graduate destinations, and a final paragraph about salaries. This helps the reader recognise the two parts of the task. However, progression within the paragraphs is limited, and several ideas are repeated, such as “There are many changes recoded” and “according to the chart/table.” The transition “On the other hand” does not express a clear contrast between the visuals. In the salary paragraph, the sequence of percentages is difficult to follow because the figures are not clearly linked to each employment category. Organise the report around an overview followed by focused comparisons, and use linking phrases only when they show a genuine relationship between ideas.
Lexical Resource: Band 5.0
You use relevant task vocabulary, including “graduates,” “full-time work,” “postgrad study,” “unemployed,” and “salaries,” so the topic is generally recognisable. However, the range is limited and several word choices or collocations are inaccurate or repetitive. For example, “discuss about destination” is not a natural way to describe reporting chart data, and “changes recoded” is repeated without conveying a precise trend. There are also spelling errors such as “statments,” “fame,” “recoded,” and “explination.” Use concise reporting language and precise comparison terms, such as “accounted for,” “the largest proportion,” and “was more common than.”
Grammatical Range and Accuracy: Band 4.5
Most sentences rely on simple patterns, and attempts at longer constructions are often inaccurate. For instance, “The chart illustrates information about Anthropology graduates did after finishing…” is missing a grammatical link such as “what,” while “Unemployed percentage is to 12%” uses an incorrect sentence pattern. The opening also shifts awkwardly from “The chart illustrates” to “we discuss,” and capitalisation after commas or within sentences is inconsistent. These errors sometimes make the intended relationships unclear, although the reader can usually identify the figures being reported. Practise accurate clauses with “that/what,” consistent past or present reporting forms, and complete comparisons such as “the proportion of graduates in full-time work was 52%.”
See this exact question answered at other band scores. The same prompt compared across bands.
Browse more IELTS Writing model answers or get your own writing scored by the same AI examiner.