Band 6.0 IELTS Writing Task 1 Model Answer
Overall Band Score: 6.0 · Cambridge IELTS 15 · 2026-11-12
IELTS Writing Task 1 question
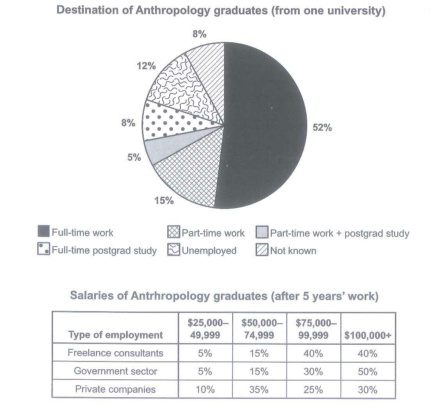
The chart below shows what Anthropology graduates from one university did after finishing their undergraduate degree course. The table shows the salaries of the anthropologists in work after five years.
Summarize the information by selecting and reporting the main features and make comparison where relevant.
Student answer (Band 6.0)
The chart illustrates the information about the Anthropology graduates from one university after compeleting their undergraduate degree course.
The chart is divided into 6 parts namely Full time work, part time work, part time work + postgrad study, full time postgrad study, unemployed and not known.
Full time work carry's the highest weightage in the chart which is 52%, meanwhile part time work comes 2nd with 15%. shockingly unemployement rate is 12% which is higher than full time postgrad study. Not know and full time postgrad study has 8% simultaneously.
Table indicates the salary of antropology graduates after 5 year's of work. There are 3 types of employement mentioned in the chart which are freelance consultants, government sector and private companies.
Salary range starts from 25000$ upto [redacted phone]$+. There are 5% of freelance consultants who are earning in bracket of 25000$ to 49999$, also 15% of them are earning 50000$ to 74999$ and 40-40% of their who are in above salary bracket which is 75000$ to [redacted phone]$+
Government sector has good earning potential as there are 50% of them who are in [redacted phone]$+ salary bracket. rest are in other salary brackets.
Private companies has less earning potential in salary bracket of [redacted phone]$+, there are only 30% which is lowest compare to freelance consultants and government sector.
AI examiner evaluation
| Criterion | Band |
|---|---|
| Task Achievement / Task Response | 5.5 |
| Coherence and Cohesion | 6.0 |
| Lexical Resource | 6.0 |
| Grammatical Range and Accuracy | 5.5 |
| Overall | 6.0 |
Task Achievement / Task Response: Band 5.5
You report several key figures accurately, including full-time work at 52%, part-time work at 15%, unemployment at 12%, and the 50% of government employees earning $100,000 or more. You also identify the main destination category and compare the highest salary bracket across employment types. However, the response lacks a clear overall summary of the main patterns across both visuals. Some table information is only partly reported: for example, you say the remaining government-sector employees are in other brackets without giving their distribution, and you do not describe the private-company salary bands below $100,000. The statement that private companies have “less earning potential” is also too broad; the table shows a distribution, not earning potential. Select and compare the most important patterns more fully to make the report more complete.
Coherence and Cohesion: Band 6.0
The response is arranged in a generally logical order: it introduces the chart, describes graduate destinations, then turns to the salary table. Paragraph breaks help distinguish these sections, and linking expressions such as “meanwhile” and “also” make some relationships clear. However, the organisation is somewhat list-like, with figures reported one after another rather than grouped into a clear overview and supporting comparisons. The final paragraph gives only one private-company figure, so the comparison is not fully developed. Some connections are also awkward, such as “Not know and full time postgrad study has 8% simultaneously,” which makes the relationship between the categories unclear. A concise overview followed by grouped comparisons would create stronger progression.
Lexical Resource: Band 6.0
You use an adequate range of vocabulary for describing charts and salaries, including “salary range,” “earning bracket,” “freelance consultants,” and “earning potential.” These terms help communicate the subject, and most of the intended meaning remains understandable. However, some choices are inaccurate or unnatural for formal data reporting: “highest weightage” is not a natural way to describe the largest proportion, while “shockingly” adds an unsupported emotional judgement. There are also spelling errors, including “compeleting,” “unemployement,” and “antropology,” and inconsistent forms such as “employement.” Aim for precise, neutral reporting language and check spelling and word forms carefully.
Grammatical Range and Accuracy: Band 5.5
You attempt both simple statements and longer sentences, for example, “Full time work carry's the highest weightage in the chart which is 52%,” and the sentence comparing the private-company figure with the other sectors. The main information is usually understandable, but some grammatical errors affect clarity. Subject–verb agreement is inconsistent in “Full time work carry's” and “Private companies has,” and the sentence “Not know and full time postgrad study has 8% simultaneously” has an unclear structure. Several sentences also join ideas awkwardly, particularly the long sentence about freelance consultants’ salary brackets. Use accurate agreement, form complete comparisons, and punctuate longer sentences so each figure is clearly linked to its category.
See this exact question answered at other band scores. The same prompt compared across bands.
Browse more IELTS Writing model answers or get your own writing scored by the same AI examiner.