Band 5.5 IELTS Writing Task 1 Model Answer
Overall Band Score: 5.5 · Cambridge IELTS 15 · 2026-11-14
IELTS Writing Task 1 question
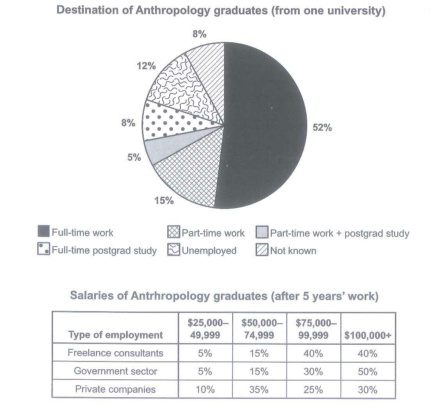
The chart below shows what Anthropology graduates from one university did after finishing their undergraduate degree course. The table shows the salaries of the anthropologists in work after five years.
Summarize the information by selecting and reporting the main features and make comparison where relevant.
Student answer (Band 5.5)
The pie chart illustrates the proportion of students who studyed Anthropology after complited their undergradute degree from a university and what they did after that. The table compares the percentage of monthly income of the anthropology in work after five years.
It is clear that the highest percentage of students joined full time work, and the percentage of student who chose part-time work was the lowest. However, the highest percenatge of salaries after 5 year work in government sector.
The pie chart in more details, the percentage of students after complited degree from Anthropoly subject most of the student joined as full time work 52%, whereas a few students choce part-time work,unemployment and not known which was 15%, 12% and 8% respectivelly.
Additionally the total salaries of anthropology graduates after 5 years. The percentage of student who joined as freelance consultants they got salaries around 40%. Moreover the percentage of students who joined government sector their monthly income ater 5 year 50%. However, student who joined private companies they got least monthly income than other two sector.
AI examiner evaluation
| Criterion | Band |
|---|---|
| Task Achievement / Task Response | 6.0 |
| Coherence and Cohesion | 5.5 |
| Lexical Resource | 5.0 |
| Grammatical Range and Accuracy | 5.0 |
| Overall | 5.5 |
Task Achievement / Task Response: Band 6.0
You identify the main destination clearly: full-time work is the largest category at 52%, and you also compare salary outcomes across the three employment sectors. The overview that government employees have the highest salary share is supported by the 50% earning $100,000 or more. However, some details are incomplete or unclear. You call part-time work the lowest destination, although part-time work plus postgraduate study is lower at 5%; the 8% full-time postgraduate-study group is also omitted. In the table discussion, “they got salaries around 40%” does not specify that 40% of freelance consultants earned $75,000–$99,999 and another 40% earned $100,000 or more. Report the salary bands explicitly and make comparisons across all rows more precise.
Coherence and Cohesion: Band 5.5
The response has a recognisable structure: an introduction, an overview, and separate discussion of the chart and table. This gives the reader a basic route through the information. However, progression within paragraphs is sometimes unclear, and some linking is mechanical or imprecise. For example, “The pie chart in more details” does not form a clear transition, while “Additionally the total salaries” introduces the table without explaining the comparison that follows. The overview also combines two points without clearly distinguishing graduate destinations from salary patterns. Use topic sentences to signal each section, then group related figures—for example, destinations first and salary bands by sector second—and use clear references such as “the proportion earning at least $75,000.”
Lexical Resource: Band 5.0
You use some relevant task vocabulary, including “proportion,” “percentage,” “full time work,” “freelance consultants,” and “government sector,” so the subject is generally understandable. However, the range is limited and several word choices or collocations are inaccurate, which makes some statements difficult to interpret. “Percentage of monthly income” is not an accurate description of the table, which reports salary bands, and “they got salaries around 40%” confuses a salary amount with a proportion of workers. Spelling errors such as “Anthropoly,” “respectivelly,” and “percenatge” also reduce precision. Build a more accurate set of chart phrases, such as “accounted for,” “earned between,” and “the share of graduates,” and check spelling before submitting.
Grammatical Range and Accuracy: Band 5.0
You attempt both simple statements and longer sentences, including a contrast with “whereas” and a sentence beginning “However,” which shows some variety. Nevertheless, control is uneven, and errors in sentence formation, verb forms, agreement, and punctuation sometimes make the meaning hard to follow. For instance, “The pie chart in more details” is a sentence fragment, and “the percentage of students after complited degree … most of the student joined” lacks a clear grammatical structure. In “the percentage of students who joined government sector their monthly income ater 5 year 50%,” the relationship between the subject and the figure is not expressed correctly. Practise complete clauses with a clear subject and verb, and use accurate past-tense reporting, articles, and plural forms.
See this exact question answered at other band scores. The same prompt compared across bands.
Browse more IELTS Writing model answers or get your own writing scored by the same AI examiner.