Band 5.5 IELTS Writing Task 1 Model Answer
Overall Band Score: 5.5 · Cambridge IELTS 15 · 2026-11-15
IELTS Writing Task 1 question
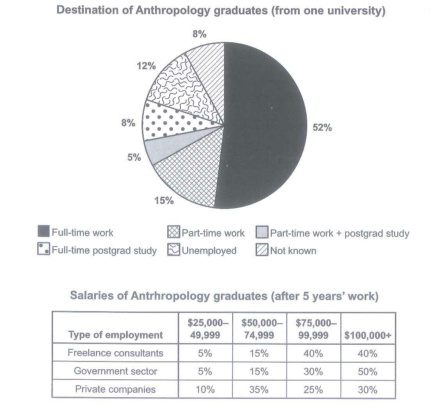
The chart below shows what Anthropology graduates from one university did after finishing their undergraduate degree course. The table shows the salaries of the anthropologists in work after five years.
Summarize the information by selecting and reporting the main features and make comparison where relevant.
Student answer (Band 5.5)
The pie chart display's the types of anthropology graduates from particular one university after finishing their bacholer's degree course. While the table represents the salaries of the anthorpologists in work after five years.Overall, in the pie char the full-time works are the highest and the part-time work plus postgrad study are the lowest, whereas Government sector have the highest percentage of antrhropology graduates.
The Pie Chart, the full-time work havemajority of 52 percent of graduates, where part-time work and unemployed are close to each other 15% and 12%, whereas full-time postgrad study and not known has the same ratio of 8 percent in the chart and part-time work plus postgrad study has 5 percent which the lowest among others.
The table show the four type of salaries and three types of employment where the graduates have atleast 5 years of work expernise . Freelance consultants has 5 percent in 25,000 to 49,999 salary range, 15 percent in 50,000 to 74,999 , 40 percent in 75,000 to 99,999 and same 40 percent in 100,000 pus range, wgre
AI examiner evaluation
| Criterion | Band |
|---|---|
| Task Achievement / Task Response | 5.0 |
| Coherence and Cohesion | 5.5 |
| Lexical Resource | 5.5 |
| Grammatical Range and Accuracy | 5.0 |
| Overall | 5.5 |
Task Achievement / Task Response: Band 5.0
You identify several key figures accurately, including full-time work as the largest destination (52%) and the combined part-time-work/postgraduate-study category as the smallest (5%). You also note that the two 8% categories are equal. However, the overview misrepresents the table: government employment does not have the highest percentage of graduates; the table compares salary bands within employment types. The response gives only the freelance-consultant figures and stops before reporting the government and private-company distributions, so an important part of the task is left incomplete. To strengthen the report, summarise the main salary pattern across all three sectors and make a clear comparison, such as the government sector’s 50% share in the highest band versus 30% for private companies.
Coherence and Cohesion: Band 5.5
The response has a recognisable structure, moving from an introduction and overview to separate discussion of the chart and table. This helps the reader distinguish the two visuals, and linking words such as “whereas” and “while” show an attempt to compare information. However, progression is weakened by unclear or incomplete sentences, especially the final table description, which ends with “wgre” and leaves the discussion unfinished. Some links are also awkward or repetitive, and the overview’s comparison between the chart and table is not clearly expressed. Use complete paragraphs with a clear topic for each, and finish the table paragraph by covering all employment sectors before drawing a concise comparison.
Lexical Resource: Band 5.5
You use some relevant task vocabulary, including “full-time work,” “postgrad study,” “salary range,” and “percentage,” so the topic is generally understandable. However, spelling errors and imprecise phrasing are noticeable, for example “bacholer's,” “anthorpologists,” “expernise,” and “100,000 pus.” There are also awkward combinations such as “the types of anthropology graduates” and “the full-time works,” which make the meaning less natural. Aim for accurate, consistent terms such as “destinations,” “graduates in full-time employment,” and “salary band.” Proofreading spelling and choosing standard collocations would make the report clearer and more appropriate for an academic summary.
Grammatical Range and Accuracy: Band 5.0
You attempt both simple and more complex sentences, including a contrast with “While the table represents…” and a longer sentence comparing several chart categories. However, grammatical errors are frequent and sometimes make the relationships between ideas difficult to follow. For example, “The pie chart display's” has incorrect verb form and punctuation, while “Government sector have” has subject–verb disagreement. The opening “While the table represents…” is a dependent clause presented as a sentence, and “The table show” also has incorrect agreement. Sentence boundaries and punctuation are inconsistent, particularly where sentences run together. Practise forming complete sentences, checking singular and plural subjects, and using commas and full stops to separate ideas.
See this exact question answered at other band scores. The same prompt compared across bands.
Browse more IELTS Writing model answers or get your own writing scored by the same AI examiner.