Band 6.0 IELTS Writing Task 1 Model Answer
Overall Band Score: 6.0 · Cambridge IELTS 15 · 2026-11-15
IELTS Writing Task 1 question
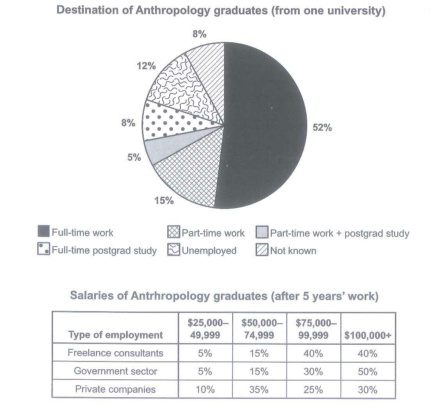
The chart below shows what Anthropology graduates from one university did after finishing their undergraduate degree course. The table shows the salaries of the anthropologists in work after five years.
Summarize the information by selecting and reporting the main features and make comparison where relevant.
Student answer (Band 6.0)
The pie chart illustrates what Anthropology graduates did after completing their undergraduate degree course from one university, while The tables provides information about the salaries of them in work sector after 5 years.
Overall, it is evident that most of the anthropologists do full-time work, while a short proportion are interested in part-time work and postgrad study. Regarding salaries the highest category earned by the students who worked in Government sector while Private company employer got the lowest after doing 5 years' work.
Looking at the pie chart in more detail, Full-time work accounted for the highest figure, 52% while the lowest made by the part-time worker and postgrad students, 5%. 15% of graduates were did part-time work and 12% were umemployed. In addition, both Full-time postgrad study and unknown graduates shares the same proportion at 8% after finishing graduation.
Turning to the salary table, the highest salary category of more than $[redacted phone] are earned by the Government sector , compared to the freelance consultants at 40% and private companies at 30%. While, at the range of $75000 to $99999 the graduates who worked in Freelance consultants paid highly for 40%, government sector followed by 30% and private companies are 25%. 15% employee in the freelance consultant and Government sector earned between $50000 and $74000, while Private companies are 35%. In the lowest category both Freelance and Government sector got 5% while private company got 10%.
AI examiner evaluation
| Criterion | Band |
|---|---|
| Task Achievement / Task Response | 6.0 |
| Coherence and Cohesion | 6.0 |
| Lexical Resource | 5.5 |
| Grammatical Range and Accuracy | 5.5 |
| Overall | 6.0 |
Task Achievement / Task Response: Band 6.0
You cover both visuals and identify the main destination pattern: full-time work is the largest group at 52%, while part-time work combined with postgraduate study is the smallest at 5%. You also report the salary figures across all three employment types, and most of these numbers match the chart. However, the overview is partly unclear: “the highest category earned by the students who worked in Government sector” does not specify that the government sector has the largest share in the $100,000+ bracket, at 50%. The claim that private-company employees “got the lowest” is too broad, since they lead in the $50,000–74,999 bracket. Make the overview more precise by comparing the salary distributions overall and identifying the key contrasts, rather than implying one sector is lowest across the table.
Coherence and Cohesion: Band 6.0
The response has a clear overall arrangement: an introduction, an overview, a paragraph on graduate destinations, and a final paragraph on salaries. This makes the two visuals easy to locate, and transitions such as “Looking at the pie chart” and “Turning to the salary table” help signal the shift in focus. Some connections are less effective, however. The overview’s salary comparison is difficult to interpret, and the final paragraph moves through salary bands without consistently guiding the reader from one category to the next. “While” also begins a sentence fragment in “While, at the range…”. Use a consistent order for the salary bands and connect each comparison within complete sentences; clearer referencing would make the progression smoother.
Lexical Resource: Band 5.5
You use relevant task vocabulary, including “accounted for,” “proportion,” “salary category,” and “earned between,” which allows you to describe both the chart and table. There is also some variety in how you refer to the groups. However, several word choices and collocations are inaccurate or awkward, such as “a short proportion,” “the lowest made by,” “highest salary category … are earned,” and “paid highly.” These choices sometimes make the intended comparison less precise. Spelling and word-form slips such as “umemployed” and “employer” for employees also reduce control. Aim for standard data-reporting expressions and use the same accurate labels for groups throughout, for example “the smallest share” and “the proportion earning over $100,000.”
Grammatical Range and Accuracy: Band 5.5
You attempt both simple and more complex sentence forms, including a contrast with “while” and a comparison using “compared to.” The main information is generally understandable, but some errors in agreement, verb forms, articles, and sentence construction remain. For example, “the tables provides” has a subject–verb agreement error, and “15% of graduates were did part-time work” combines incompatible verb forms. In “the highest salary category … are earned,” the subject and verb do not agree, while “While, at the range…” is an incomplete dependent clause. Review agreement with singular and plural subjects, and make sure each sentence has a complete main clause. More accurate control of these patterns would make your comparisons easier to follow.
See this exact question answered at other band scores. The same prompt compared across bands.
Browse more IELTS Writing model answers or get your own writing scored by the same AI examiner.