Band 5.5 IELTS Writing Task 1 Model Answer
Overall Band Score: 5.5 · Cambridge IELTS 15 · 2026-11-16
IELTS Writing Task 1 question
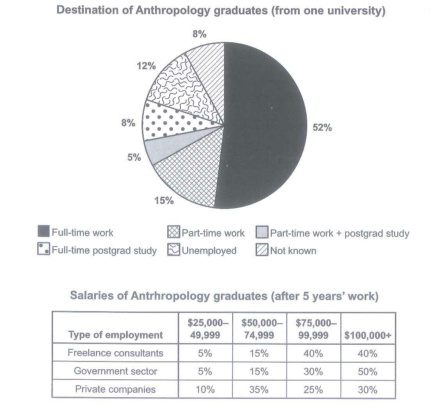
The chart below shows what Anthropology graduates from one university did after finishing their undergraduate degree course. The table shows the salaries of the anthropologists in work after five years.
Summarize the information by selecting and reporting the main features and make comparison where relevant.
Student answer (Band 5.5)
The pie chart illustrates the destination of Anthropology graduates from a college after completing their bachelor, while the table provides information about the income of anthropology graduates in profession after five years.
Overall, it is apparent that the figure for full-time work recorded the highest proportion of anthropology graduates among all the categories. In addition, the highest percentage of graduates salaries was paid by government sector.
In terms of anthropology graduates destination, the largest proportion of graduates was on full-time work, accounted for 52% , while the percentage of part-time work and postgraduate study was the lowest which represented 5%. The figure for only part-time work accounted for 15%, followed by unemployed, at 12%. Moreover, the percentages of full-time postgraduation study and unknown graduates plan were similar, with 8% of the total anthropology graduates.
The salaries for over $100,000, government sector accounted for the largest percentage of graduates, at 50%
compared with 40% and 30% for freelance consultants and private companies, respectively. Freelance consultants consisted of 40% anthropologists in the salary range of $75,000 to $99,999, whereas government sector and private companies were 30% and 25%, respectively. The salary range of $ 25,000 to 49,999 and also $50,000 to $74,999 , which represented similar percentages for both freelance consultants and government sector, with 5% and 15% , respectively.
AI examiner evaluation
| Criterion | Band |
|---|---|
| Task Achievement / Task Response | 5.5 |
| Coherence and Cohesion | 5.5 |
| Lexical Resource | 5.5 |
| Grammatical Range and Accuracy | 5.5 |
| Overall | 5.5 |
Task Achievement / Task Response: Band 5.5
You identify the main destination category correctly: full-time work is the largest at 52%, and the combined part-time work and postgraduate-study group is the smallest at 5%. You also report several salary figures accurately, including the government sector’s 50% in the highest band and the 40% figure for freelance consultants in the $75,000–99,999 band. However, the overview is incomplete and partly inaccurate: “the highest percentage of graduates salaries was paid by government sector” is unclear and does not capture the table’s broader pattern. The response also omits the private-company figures for two salary bands and does not compare the overall salary distributions clearly. Select the key contrasts across all three employment types and state them explicitly in the overview.
Coherence and Cohesion: Band 5.5
The response has a recognisable structure: an introduction, an overview, a paragraph on graduate destinations and a paragraph on salaries. This gives the reader a basic route through the information. However, progression within the salary paragraph is less clear. It moves from the highest salary band to the $75,000–99,999 band, then to the two lowest bands, without consistently comparing all three employment types. The final sentence is also difficult to follow because its opening phrase does not connect smoothly to the comparison that follows. Linking expressions such as “by contrast” or “whereas” could make the comparisons more explicit, while grouping the salary data by bands would improve the paragraph’s logical flow.
Lexical Resource: Band 5.5
You use relevant task vocabulary, including “proportion,” “accounted for,” “salary range” and “respectively,” and the meaning is generally understandable. However, several word choices and collocations are noticeably inaccurate or unnatural, such as “graduates was on full-time work,” “graduates plan,” and “the highest percentage of graduates salaries was paid.” “In profession” is also an imprecise way to describe employment. These choices sometimes make the intended comparison harder to interpret, particularly in the overview and salary paragraph. Aim for standard chart-reporting phrases such as “worked full time,” “graduates’ destinations were unknown,” and “the proportion earning…” Check that nouns and verbs fit the relationship being described, rather than relying repeatedly on “accounted for.”
Grammatical Range and Accuracy: Band 5.5
You attempt a mixture of simple and more complex sentences, including clauses with “while,” “whereas” and “with,” and the main figures can usually be understood. However, errors recur in sentence construction and agreement. For example, “the largest proportion of graduates was on full-time work, accounted for 52%” combines an awkward clause with an incomplete participial construction; “the percentage … was the lowest which represented 5%” also needs clearer clause structure. There are problems with articles, plurals and punctuation, as in “government sector” and the inconsistent spacing around commas and dollar signs. Use complete, parallel comparison structures—for example, “Full-time work accounted for 52%, whereas part-time work accounted for 15%”—and proofread each sentence for a clear subject and verb.
See this exact question answered at other band scores. The same prompt compared across bands.
Browse more IELTS Writing model answers or get your own writing scored by the same AI examiner.