Band 6.0 IELTS Writing Task 1 Model Answer
Overall Band Score: 6.0 · Cambridge IELTS 15 · 2026-11-16
IELTS Writing Task 1 question
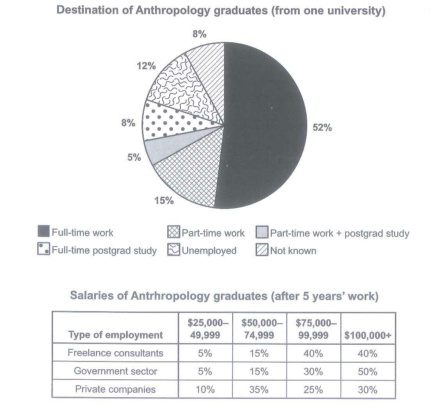
The chart below shows what Anthropology graduates from one university did after finishing their undergraduate degree course. The table shows the salaries of the anthropologists in work after five years.
Summarize the information by selecting and reporting the main features and make comparison where relevant.
Student answer (Band 6.0)
Given are a pie chart and a table illustrating the post study work types of Anthropology graduates of a university and the salary scales of anthropologists in work after five years respectively.
Overall, most people tend to do full-time work after their graduation and least do the part-time work with postgraduate studies. The most anthropologists who work in government sector earn more than $100,000.
Significantly higher amount of students are working full-time after the graduation and it represents as 52%. Second most common type of work among people is part-time work. Both full-time postgraduate students and the percentage of students who not known the work are same in 8%. There is a considerable amount of unemployers can be seen. The percentage of unemployees are 12%. The students who do the part-time work with postgraduate study are significantly lower than other categories and it is about 5%.
In the government sector, most anthropologists earn more than $100,000 and fewer percentage of anthropologitsts earn between $25,000 and $49,999. 5% of both freelance consultants and government sector employees take the salary between $25,000 and $49,999 and 15% earn salary between $50,000- $74,999. Most employees in private companies earn between $50,000- $74,999. Furthermore, least percentage of employees earn between $25,000-$49,999 in private companies.
AI examiner evaluation
| Criterion | Band |
|---|---|
| Task Achievement / Task Response | 6.5 |
| Coherence and Cohesion | 6.5 |
| Lexical Resource | 5.5 |
| Grammatical Range and Accuracy | 5.5 |
| Overall | 6.0 |
Task Achievement / Task Response: Band 6.5
You cover both visuals and give a clear overview: full-time work is the largest destination (52%), while part-time work combined with postgraduate study is the smallest (5%); you also identify the government sector’s high share in the top salary band. Most figures you report match the data, including the 8% categories and the 12% unemployed. However, the salary comparison is selective: you omit the 40% earning $75,000–$99,999 among freelance consultants and the 35% earning $50,000–$74,999 in private companies, and you do not compare the top salary bands across all three employment types. The overview also says “least do” part-time work with postgraduate studies, which is imprecise because it is the smallest category, not a description of people’s general tendency. More balanced selection and clearer comparisons would strengthen coverage.
Coherence and Cohesion: Band 6.5
The response has a sensible overall structure: an introduction, an overview, then separate paragraphs for the chart and salary table. This makes the two sources easy to distinguish, and sequencing within the destination paragraph is generally clear. Some linking and reference choices are less controlled, however. “Second most common type” is not followed by its figure, while “There is a considerable amount…” interrupts the sequence without a clear comparison. In the salary paragraph, the repeated “most” and “least” statements create a list-like progression, and “Furthermore” adds little because the final point is closely related to the preceding one. Group salary bands by employment type or compare the highest and lowest bands across sectors to create a more continuous line of comparison.
Lexical Resource: Band 5.5
You use a relevant range of task vocabulary, including “salary scales,” “full-time work,” “postgraduate studies,” and “government sector,” so the main information is usually understandable. However, several word choices and forms are inaccurate or unnatural, which limits precision: “unemployers” and “unemployees” are not appropriate terms, “students who not known the work” is unclear, and “least do” is an awkward way to describe the smallest category. There are also spelling errors such as “anthropologitsts.” Aim for accurate collocations and consistent labels for graduates and employment categories. For example, use “unemployed graduates,” “the destination was unknown,” and “the smallest proportion” rather than inventing forms or using vague phrasing.
Grammatical Range and Accuracy: Band 5.5
You attempt both simple and more complex sentence forms, and the overall meaning can generally be followed. Some grammatical errors remain, particularly with articles, agreement, and sentence construction. For example, “after their graduation” is less natural than “after graduation,” and “it represents as 52%” has an incorrect verb pattern. In “Both full-time postgraduate students and the percentage of students who not known the work are same in 8%,” the structure and missing verb make the relationship difficult to read. “The percentage of unemployees are 12%” also has subject–verb disagreement. Use direct constructions such as “Full-time work accounted for 52%” and check that each sentence has a clear subject and correctly formed verb. Greater accuracy in these patterns would improve control.
See this exact question answered at other band scores. The same prompt compared across bands.
Browse more IELTS Writing model answers or get your own writing scored by the same AI examiner.