Band 5.5 IELTS Writing Task 1 Model Answer
Overall Band Score: 5.5 · Cambridge IELTS 15 · 2026-11-17
IELTS Writing Task 1 question
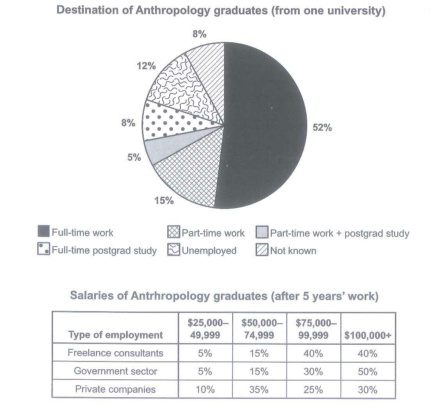
The chart below shows what Anthropology graduates from one university did after finishing their undergraduate degree course. The table shows the salaries of the anthropologists in work after five years.
Summarize the information by selecting and reporting the main features and make comparison where relevant.
Student answer (Band 5.5)
The charts illustrates the destination of Anthropology graduates from one university and their salaries after 5 years' work. Overall, the highest number of students accounted for full-time work, while the percentage of students who full-time postgrad study and not known represented the smallest figure. The highest salaries recorded in government sectors, whereas the private companies showed the lowest salary of the total.
Looking at the pie chart, full-time work had the highest percentage at 52%, followed by part-time work , which accounted for 15% . Similarly, 12% students represented for unemployment, whilst students of full-time postgrad studey and not known about their field remained constant at 8%. Students who do part-time work+ postgrad study showed the minimum percentage at 5%.
Turning to table, 5% freelancer consultants recorded salaries $25000-49,999, followed by 15% earned $50,000-74,999, while 40% graduated stood at 40% with $75,000-99,999. Similarly, 40% stusents earned $100,000 afte
AI examiner evaluation
| Criterion | Band |
|---|---|
| Task Achievement / Task Response | 4.5 |
| Coherence and Cohesion | 6.0 |
| Lexical Resource | 6.0 |
| Grammatical Range and Accuracy | 5.5 |
| Overall | 5.5 |
Task Achievement / Task Response: Band 4.5
You identify the main destination, correctly reporting full-time work at 52%, and include several other accurate figures. However, the response covers the salary table only briefly and then stops mid-sentence (“40% students earned $100,000 afte”), so it does not compare the three employment sectors or give a complete account of the salary distribution. The overview is also partly inaccurate: full-time postgraduate study and “not known” are tied at 8%, but the smallest destination category is part-time work plus postgraduate study at 5%; and the table does not show that private companies had the lowest salaries overall. The response is also two words below the required minimum. To improve, complete the table summary, compare the highest salary bands across sectors, and make the overview reflect the clearest patterns.
Coherence and Cohesion: Band 6.0
The response has a recognisable structure: an introduction and overview are followed by a paragraph on the pie chart and one beginning the table discussion. Sequencing phrases such as “Looking at the pie chart” and “Turning to table” help signal the shift between visuals. However, the final paragraph ends abruptly, leaving the comparison unfinished and weakening the overall progression. Some links are also mechanical or unclear: “Similarly” does not express a meaningful comparison when introducing the 12% unemployment figure, and “the highest salaries recorded in government sectors” is not clearly connected to the table evidence. Develop the final paragraph to completion and use linking expressions that show precise relationships between figures.
Lexical Resource: Band 6.0
You use a reasonable range of task-related vocabulary, including “accounted for,” “followed by,” “represented,” and “recorded,” and the reader can generally understand the intended comparisons. Some word choices and collocations are inaccurate or awkward, however. For example, “students represented for unemployment” and “not known about their field” do not express the chart categories naturally; “graduates” or “respondents” would be more suitable than “students” in this context. There are also spelling errors such as “studey” and “stusents,” and “freelancer consultants” is not the correct label. Aim for precise chart terminology and check spelling, especially in key category names.
Grammatical Range and Accuracy: Band 5.5
You attempt both simple and more complex sentence forms, including a contrast with “while” and a clause introduced by “whereas.” Meaning is usually recoverable, but some grammatical errors remain. The opening should be “The charts illustrate,” because the plural subject requires a plural verb. In “the percentage of students who full-time postgrad study,” the relative clause needs a verb, while “5% freelancer consultants recorded salaries” has an unclear subject and missing grammatical links. Articles and sentence construction also need attention in phrases such as “Turning to table.” The final sentence is incomplete, which prevents the reader from seeing how the comparison was meant to continue. Proofread for agreement and complete clauses, and ensure each sentence has a clear subject and verb.
See this exact question answered at other band scores. The same prompt compared across bands.
Browse more IELTS Writing model answers or get your own writing scored by the same AI examiner.