Band 6.0 IELTS Writing Task 1 Model Answer
Overall Band Score: 6.0 · Cambridge IELTS 15 · 2026-11-17
IELTS Writing Task 1 question
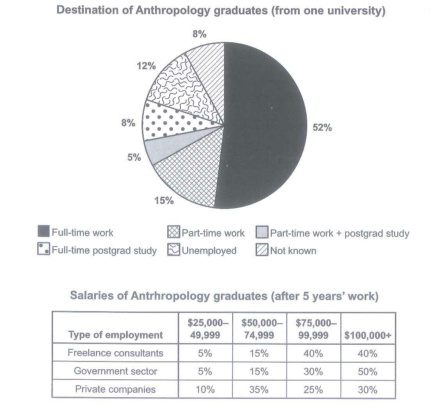
The chart below shows what Anthropology graduates from one university did after finishing their undergraduate degree course. The table shows the salaries of the anthropologists in work after five years.
Summarize the information by selecting and reporting the main features and make comparison where relevant.
Student answer (Band 6.0)
The given data can be divided into two parts. The pie chart indicates the destination of Anthropology graduates from one university and table derives salaries of Anthropology graduates after 5 years of work.
Starting from the pie chart, most of the graduates got full-time work which was about 52% of the total students. Afterwads, 15% of sudents got part-time work and 12% left unmployed after graduation. At an equal proportion that is 8% some students started full-time postgraduate studies and rest 8% left unknown. At end, the restof the 5% student tarted both part time work along ith postgraduate study.
If we talk about the salaries of students after 5 years' of work, freelance consultants earned 5% and 15% that was between $25,000-49,999 and $50,000-74,999. 40% of them got $75,000 or more han $100,000. Although the least percentage of individuals nearly 5% were getting $25,000-$49,999, 15% f them got $74,999, and 30% of them earned $75,999-$99,999. Surprisingly, the highest percentage of students (50%) earned more than $100,000 in government sector. In private companies, maximum of employees (35%) got their salaries in between $50,000-74,999 but around 10% of them receive $25,0000-49,999. 25% of them got $75,999-99,999 and only 30% got salary of $100,000.
Overall we can say that, mot of the students covered the full time jobs a per the pie chart and the students earning highest were siuated in the gvernment sector.
AI examiner evaluation
| Criterion | Band |
|---|---|
| Task Achievement / Task Response | 6.0 |
| Coherence and Cohesion | 6.5 |
| Lexical Resource | 5.5 |
| Grammatical Range and Accuracy | 5.5 |
| Overall | 6.0 |
Task Achievement / Task Response: Band 6.0
You cover both visuals and identify the main destination, full-time work, as the largest category, while also noting unemployment and the two 8% groups. The salary section includes several relevant comparisons, including the government sector’s 50% in the highest band and private employees’ 35% in the $50,000–74,999 range. However, some figures are misreported or unclear: freelance consultants’ 40% are in each of the two highest bands, not “$75,000 or more than $100,000”; the government figures are confused, and the private-company band is $75,000–99,999, not $75,999–99,999. The overview is relevant but could summarise the salary pattern more accurately and clearly.
Coherence and Cohesion: Band 6.5
The response has a clear overall arrangement: it introduces the two visuals, discusses the pie chart, then the salary table, and ends with an overview. This makes the information easy to follow at a general level. Sequencing phrases such as “Starting from the pie chart” and “If we talk about the salaries” help signal the shift, although they sound formulaic, and “Afterwards” does not express a meaningful sequence between categories. The salary paragraph would be more coherent if each employment type were treated in turn and its figures presented in a consistent order. Some references, such as “the rest 8%” and “them,” are not fully clear. More precise linking and grouping would make progression smoother.
Lexical Resource: Band 5.5
You use enough topic vocabulary to describe the visuals, including “full-time work,” “postgraduate studies,” “freelance consultants,” and “government sector.” The range is adequate for the task, but several word choices and collocations are inaccurate or awkward, such as “table derives salaries,” “left unknown,” and “covered the full time jobs.” Spelling errors—including “Afterwads,” “sudents,” “unmployed,” and “gvernment”—are noticeable and reduce the polish of the report. Some salary descriptions are also imprecise: “got $74,999” does not clearly describe a salary band. Use standard chart-reporting phrases such as “the table shows,” “were employed,” and “earned between” to improve precision and naturalness.
Grammatical Range and Accuracy: Band 5.5
You attempt both simple and more complex sentence forms, and most of the main comparisons remain understandable. However, some grammatical errors recur in sentence construction, articles, and agreement. For example, “table derives salaries” lacks a suitable subject–verb construction, while “At an equal proportion that is 8% some students started…” is difficult to parse. In “the rest of the 5% student tarted,” the article and singular noun do not fit the percentage, and “the highest percentage of students … earned” incorrectly treats salary-table employees as students. Punctuation around introductory phrases is also inconsistent. Aim for direct, complete sentences with accurate plural forms and clear subjects, especially when comparing the three employment sectors.
See this exact question answered at other band scores. The same prompt compared across bands.
Browse more IELTS Writing model answers or get your own writing scored by the same AI examiner.