Band 4.0 IELTS Writing Task 1 Model Answer
Overall Band Score: 4.0 · Cambridge IELTS 15 · 2026-11-17
IELTS Writing Task 1 question
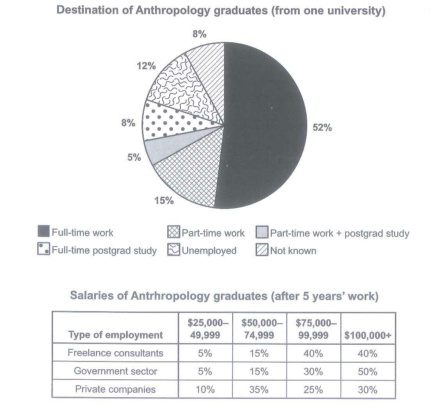
The chart below shows what Anthropology graduates from one university did after finishing their undergraduate degree course. The table shows the salaries of the anthropologists in work after five years.
Summarize the information by selecting and reporting the main features and make comparison where relevant.
Student answer (Band 4.0)
The pie chart give information about destination of anthropology graduates from one university, they did after finshing their undergraduate degree course. The pie chart show persantage of salaries of the anthropologists in the work after five years. Overall, they show full-time work, part -time work, part-time work+postgrad study, full-time postgrad study, unemployed and not known.
They finally highest one is full-time work is 52%. the lowest one is part-time work + postgrad study and also 8% is full-time postgrad study. they allso give information about 15% of not known and they show 12% of unemployed. They mainly show about salaries of the antropologists. That is very good is 52% is full time worker. The university is take care about unemployed because in the pie is large persantage of unemployed person. Overall the pie chart give information about us salary of anthropology from one university did after thier of
AI examiner evaluation
| Criterion | Band |
|---|---|
| Task Achievement / Task Response | 3.0 |
| Coherence and Cohesion | 4.0 |
| Lexical Resource | 4.5 |
| Grammatical Range and Accuracy | 4.5 |
| Overall | 4.0 |
Task Achievement / Task Response: Band 3.0
The response identifies the main destination categories and correctly reports that full-time work is the largest share at 52%, while also mentioning unemployment and postgraduate study. However, it misreports “not known” as 15% rather than 8%, and does not accurately describe the smallest category: part-time work plus postgraduate study is 5%. More importantly, the task includes a salary table, but the response does not report or compare any salary figures or employment sectors. The overview is unclear and includes unsupported comments such as “The university is take care about unemployed.” The response is also two words below the required minimum. To improve, give a concise overview of both visuals, select key comparisons from the table, and ensure every figure matches the data.
Coherence and Cohesion: Band 4.0
There is a basic attempt to organise the response, beginning with an introduction and using “Overall” and “They finally” to signal summary points. However, ideas do not progress clearly: the response repeats that the chart gives information, shifts between destinations and salaries, and ends with an incomplete thought (“did after thier of”). The paragraphing does not separate the two visuals or group related information, and references such as “they” and “they allso” are unclear. Some linking is present, but it does not create a coherent account of the data. Use one paragraph to introduce and summarise the graduate destinations, then another to compare salary patterns across employment types, with clear links between the figures.
Lexical Resource: Band 4.5
The response uses some task-related vocabulary, including “destination,” “undergraduate degree,” “unemployed,” and “full-time work,” so the topic is generally recognisable. However, the range is limited and several words are repeated, especially “show” and “information.” Spelling errors such as “finshing,” “persantage,” and “antropologists” reduce accuracy, while phrases such as “they finally highest one” and “very good” are imprecise or unsuitable for an objective report. “Salary” is mentioned, but the response does not use vocabulary to describe salary bands or compare sectors. Build a more precise reporting vocabulary, for example “accounted for,” “the largest proportion,” “salary bracket,” and “earned,” and check spelling before submitting.
Grammatical Range and Accuracy: Band 4.5
The response attempts several simple statements and a few longer constructions, but grammatical control is inconsistent. Subject–verb agreement is faulty in “The pie chart give information” and “The pie chart show,” and the opening sentence has an unclear structure: “they did after finshing their undergraduate degree course.” Articles and sentence boundaries are also problematic, as in “the lowest one is part-time work + postgrad study and also 8% is full-time postgrad study.” The final sentence is incomplete, which makes its meaning difficult to follow. Most sentences rely on basic patterns, with little accurate variety. Practise forming complete subject–verb sentences, use consistent plural and singular agreement, and separate comparisons into clear clauses.
See this exact question answered at other band scores. The same prompt compared across bands.
Browse more IELTS Writing model answers or get your own writing scored by the same AI examiner.