Band 5.5 IELTS Writing Task 1 Model Answer
Overall Band Score: 5.5 · Cambridge IELTS 18 · 2026-11-20
IELTS Writing Task 1 question
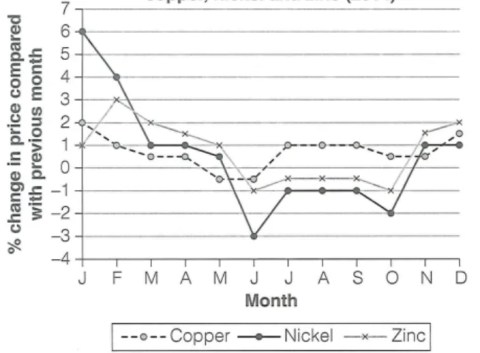
The graph below shows the average monthly change in the prices of three metals during 2014.
Summarise the information by selecting and reporting the main features, and make comparisons where relevant.
Average monthly change in prices of copper, nickel and zinc (2014)
Student answer (Band 5.5)
The line graph illustrates the average monthly change in prices of copper, nickel and zinc in 2014. Overall, it is clear that the prices of every months changed over the period, nickel showed the highest percentage in the start of the year, while the percentage of prices was decreased in remaining months. Similary, copper and zinc recorded the lowest trend during 2014.
At the beginning of the year in january, nickel accounted the highest monthly price stood at 6% ,compared to 2% of copper and 1% of zinc. In february, the prices of nickel fell sharply and stood at 4%, followed by 1% of copper and 3% of zinc. The prices of copper remained stable at 1% in march and april, while the prices of zinc fell by 2% in march and 1.8% in april. Similarly, the copper stood at 0.5% in both years in march and april.
In may, zinc metal was 1%, while the copper metal recorded a negative trend in prices at -0.5% and nickel at 0.9%. The prices of nickel fell down sharply at -3% in june, meanwhile the other two metals experienced -1% and -0.5% respectively. From july onward, the prices of all three metals recovered ,copper reached at 1% in july and the prices percentage remained constant until september. The prices of zinc was -0.5% in july and then the prices remained stable until september . In the same way, nickel prices stood at -1% in july to september, after that there was a signicificant changes in pricesof nickel from october to december start from -2% to 1%. Likewise, the prices of zinc in october was -1%, while it sharply increased at 1.55 in november before reaching 2% in december. While the prices of copper showed a noticeable changed in prices from 1% to 0.5% in october and november before peaked at 1.5% in december.
AI examiner evaluation
| Criterion | Band |
|---|---|
| Task Achievement / Task Response | 5.5 |
| Coherence and Cohesion | 6.0 |
| Lexical Resource | 5.5 |
| Grammatical Range and Accuracy | 5.5 |
| Overall | 5.5 |
Task Achievement / Task Response: Band 5.5
You cover the full year and include relevant comparisons, such as nickel’s high January figure and the metals’ negative changes around June. However, the overview is unclear and partly inaccurate: nickel did not simply decline in the remaining months, since it rose to 1% in November and stayed there in December. The claim that copper and zinc had the “lowest trend” is also too vague to summarise their overall patterns. Several figures are misreported: copper was 0.5% in March and April, not 1%; zinc was about 1.5% in April, not 1.8%; and nickel was about 0.5% in May, not 0.9%. Select the main turning points and check each figure against the graph to make the report more accurate and fully developed.
Coherence and Cohesion: Band 6.0
The response has a clear overall arrangement: an introduction and overview are followed by chronological details, with paragraph breaks that help separate the stages of the year. Linking expressions such as “At the beginning,” “In May,” and “From July onward” make the sequence easy to follow. However, some connections are mechanical or unclear. For example, “Similarly” introduces information that is not clearly parallel, and “while” at the start of the final sentence leaves the relationship between the details incomplete. Repeated references to “the prices” also make the account feel list-like. Grouping the metals’ shared movements around June and their different recoveries later in the year would create a more purposeful progression.
Lexical Resource: Band 5.5
You use a reasonable range of task-related vocabulary, including “remained stable,” “fell sharply,” “negative trend,” and “recovered,” which helps describe movement. However, several word choices and collocations are inaccurate or awkward: “nickel accounted the highest monthly price stood at” combines incompatible structures, while “prices percentage” and “signicificant changes in pricesof” are unclear or misspelled. “Lowest trend” does not express a precise comparison, and “peaked” is not the most suitable description for copper’s December rise. Aim for concise, conventional chart language such as “recorded,” “rose to,” and “fluctuated.” More accurate collocations and careful spelling would make your descriptions clearer and more natural.
Grammatical Range and Accuracy: Band 5.5
You attempt a mix of simple and complex sentences, including comparisons with “while” and time clauses such as “before reaching 2% in December.” The main message is generally understandable, but errors in sentence construction and control recur. For example, “nickel accounted the highest monthly price stood at 6%” lacks a workable grammatical structure, and “the prices of zinc was” has subject–verb disagreement. There are also problems with articles, tense and punctuation, as in “in january” and the comma splice in “recovered ,copper reached.” Use a clear subject and verb for each comparison, maintain consistent past tense, and check agreement and sentence boundaries. These changes would improve accuracy while preserving your attempts at complex forms.
See this exact question answered at other band scores. The same prompt compared across bands.
Browse more IELTS Writing model answers or get your own writing scored by the same AI examiner.