Band 6.0 IELTS Writing Task 1 Model Answer
Overall Band Score: 6.0 · Cambridge IELTS 16 · 2026-11-05
IELTS Writing Task 1 question
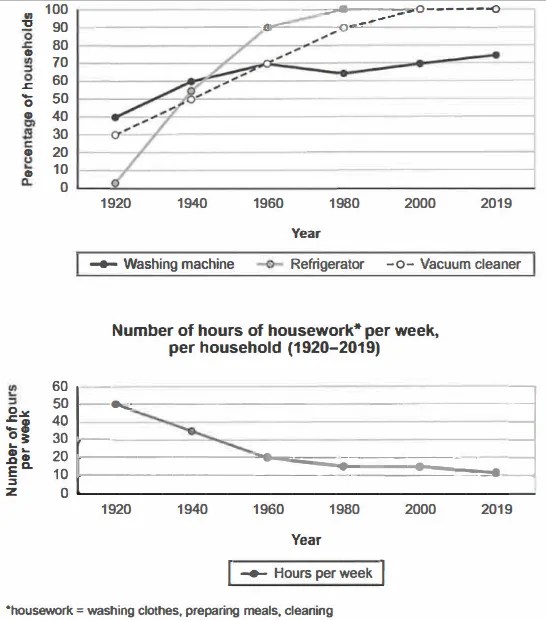
The charts below show the changes in ownership of electrical appliances and amount of time spent doing housework in households in one country between 1920 and 2019.
Summarise the information by selecting and reporting the main features, and make comparisons where relevant.
Percentage of households with electrical appliances (1920-2019)
Student answer (Band 6.0)
The line chart illustrate the changes in ownership of 3 electrical appliances and time spend doing housework in houshold in one country between 1020 and 2019.
Overall, refrigerator and vacuum cleaner are the most used electrical appliences, waching machine stand at last.
In year 1920 where percentage of washing machine in households is on 40%, which has grown to 60% in 1940 then it fluctuate till 2019 around 70%. Conversly, refrigirator and vacuum cleaner saw the sharp rise with its respect to proportion. Refrigerator uses surged from 1920 to 1960, furthermore it leveled of till 2019 and stand the proportion of 100%. There was a steady growth in case of vacuum cleaner. It started 30% in 1920 and then continuously progress with upward trend till 2000 at 100% and then straight toward 2019 waith same proportion.
The numbers of hours of per housework weekly decreased . In 1920 there was 50 hour per household which fall sharply till 2019 which remained 10 hours.
AI examiner evaluation
| Criterion | Band |
|---|---|
| Task Achievement / Task Response | 6.5 |
| Coherence and Cohesion | 6.5 |
| Lexical Resource | 5.5 |
| Grammatical Range and Accuracy | 5.0 |
| Overall | 6.0 |
Task Achievement / Task Response: Band 6.5
You cover both charts and identify the main broad patterns: appliance ownership generally rose, while weekly housework time fell. The overview also notes that refrigerators and vacuum cleaners became widespread, although calling them “the most used” is imprecise because the chart measures household ownership. Several key details are reported accurately, including washing machines at about 40% initially and vacuum cleaners reaching 100% by 2000. However, some trends are underdeveloped or unclear: the washing-machine figure dips around 1980 before rising, and the housework decline is not described in stages, despite levelling at about 15 hours from 1980 to 2000. The refrigerator’s early rise and later plateau are mentioned but not supported with figures. More precise comparisons and a clearer account of these stages would strengthen the report.
Coherence and Cohesion: Band 6.5
The response has a recognisable structure: an introduction, an overview, a paragraph on appliance ownership, and a final sentence about housework. This gives the reader a generally coherent route through the information. You also use some linking expressions, such as “Conversly” and “furthermore,” to connect trends. However, the appliance paragraph combines several series in long, loosely connected sentences, and some references are unclear—for example, “it” in the refrigerator discussion could refer to the appliance or its proportion. The final housework point is very brief and feels detached from the fuller appliance description. Grouping the appliance trends more systematically and using clearer comparisons between series would create smoother progression and cohesion.
Lexical Resource: Band 5.5
You attempt a useful range of trend vocabulary, including “surged,” “leveled off,” “steady growth,” and “upward trend,” which helps communicate changes in the data. However, inaccurate word choice and collocation sometimes make the meaning less precise. “Most used” does not describe ownership, while “washing machine stand at last” is unclear; “the least widely owned appliance” would be more suitable. There are also noticeable spelling errors, including “appliences,” “waching,” “refrigirator,” and “waith.” Some phrases, such as “percentage … is on 40%” and “straight toward 2019,” are not natural in this context. Aim for accurate, conventional chart language and check spelling carefully to make your vocabulary more reliable.
Grammatical Range and Accuracy: Band 5.0
You attempt both simple and more complex sentence forms, including clauses linked with “which” and “then,” but control is inconsistent. Errors in agreement and verb forms appear in “The line chart illustrate” and “which fall sharply,” while the opening sentence also has problems with articles and plural forms. Several constructions are incomplete or awkward, such as “In year 1920 where percentage … is on 40%” and “It started 30%.” Punctuation is also uneven, with spaces before full stops and a comma splice-like sequence in the washing-machine description. These errors sometimes make relationships between ideas harder to follow. Practise forming complete sentences with a clear subject and verb, and check tense consistency when describing past data.
See this exact question answered at other band scores. The same prompt compared across bands.
Browse more IELTS Writing model answers or get your own writing scored by the same AI examiner.