Band 5.5 IELTS Writing Task 1 Model Answer
Overall Band Score: 5.5 · Cambridge IELTS 16 · 2026-11-06
IELTS Writing Task 1 question
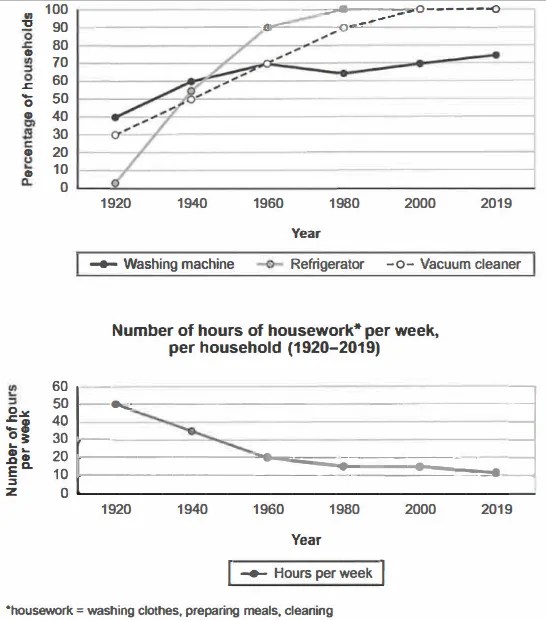
The charts below show the changes in ownership of electrical appliances and amount of time spent doing housework in households in one country between 1920 and 2019.
Summarise the information by selecting and reporting the main features, and make comparisons where relevant.
Percentage of households with electrical appliances (1920-2019)
Student answer (Band 5.5)
The given line graphs illustrate the percentages of electrical appliances and amount of time spent doing house work between the year of 1920 to 2019
overall, electrical appliances are increasing day by day in the houses where else number of hours are decreasing
First of all, in the year of 1920 percentage refrigerator was 0 that data were increased by almost 55 percentage in 1940 in the following year that same data noted with 90 precentage, after that it recorded with 100 percent and data remain same till the 2019
Secondly, Vacume cleaner was in household appliances 30 percet in the year 1920 wherelse washing machine was more populer with 10 percent in same year both data got increment of 10 percentage in 1940, in the year of 1960 washing machine and refrigerator have created meeting points with the percentage of 70. moreover vacuum cleaner's percentage were increasing day by day untill it noted highest in the year 2000 after that remain nutural till 2019.
On the otherside in the year of 1980 percentage of washing machine were sligthly fallen and regitered nealy 60 percentage after that it was gradually increasing day by day and noted with picked date of three qouters in the year 2019.Lastly, number of hours per week were countiniasly decrecasing and showed 50hrs, 35hrs, 20hrs, 15hrs and 10hrs in the years of 1920,1940, 1960, 1980, 2000 as well as 2019 repectvelly
AI examiner evaluation
| Criterion | Band |
|---|---|
| Task Achievement / Task Response | 6.0 |
| Coherence and Cohesion | 5.5 |
| Lexical Resource | 5.0 |
| Grammatical Range and Accuracy | 5.0 |
| Overall | 5.5 |
Task Achievement / Task Response: Band 6.0
You cover both charts and identify their main contrast: appliance ownership generally rose while housework time fell. Several key figures are reported accurately, including refrigerators reaching 100% by 1980 and vacuum cleaners reaching full ownership by 2000. However, some details are inaccurate: refrigerators were about 2%, not 0%, in 1920; washing machines were about 40%, not 10%, that year; and their 1980 figure was about 65%, not nearly 60%. The final housework figure is about 11 hours, rather than 10. The overview is relevant but broad, and the appliance trends receive more detail than the overall reduction in housework. More precise comparisons and a clearer summary of the main stages would strengthen the response.
Coherence and Cohesion: Band 5.5
The response has a recognisable structure, with an overview followed by paragraphs describing the appliance data and housework hours. Sequencing expressions such as “First of all,” “Secondly,” and “Lastly” help signal movement between points. However, progression within the appliance paragraph is sometimes difficult to follow: refrigerators, vacuum cleaners and washing machines are discussed together, then the washing-machine trend is revisited separately. Some linking phrases, including “where else” and “On the otherside,” are inaccurate or awkward, and long sentences joined by commas make relationships between details unclear. Organise the body by chart or by appliance, and use clear comparisons and sentence boundaries to make the progression easier to follow.
Lexical Resource: Band 5.0
You use relevant vocabulary for describing trends, including “increased,” “decreasing,” “fallen” and “highest,” so the reader can generally understand the intended changes. However, the range is limited and several word-choice, collocation and spelling problems reduce precision. Phrases such as “data were increased,” “created meeting points,” and “remain nutural” are not natural ways to describe graph values; “house work” and “Vacume” also show spelling or form errors. Repeated use of “percentage” and “day by day” makes the account less precise. Choose standard chart language and check spelling, especially for key terms, so that descriptions of rises, falls and stable figures are clear and concise.
Grammatical Range and Accuracy: Band 5.0
You attempt both simple and longer sentences, and the response communicates the broad trends. However, complex sentences are often not controlled, and errors in sentence structure and basic grammar recur. For example, “in the year of 1920 percentage refrigerator was 0” is missing articles and a clear grammatical structure, while “both data got increment” has an agreement problem. The opening sentence also lacks a full stop, and several long clauses are joined with commas rather than being separated or linked accurately. Use complete sentences with a clear subject and verb, check singular and plural agreement, and vary sentence patterns carefully. Greater control of these basics would make the information easier to read.
See this exact question answered at other band scores. The same prompt compared across bands.
Browse more IELTS Writing model answers or get your own writing scored by the same AI examiner.