Band 6.0 IELTS Writing Task 1 Model Answer
Overall Band Score: 6.0 · Cambridge IELTS 16 · 2026-11-06
IELTS Writing Task 1 question
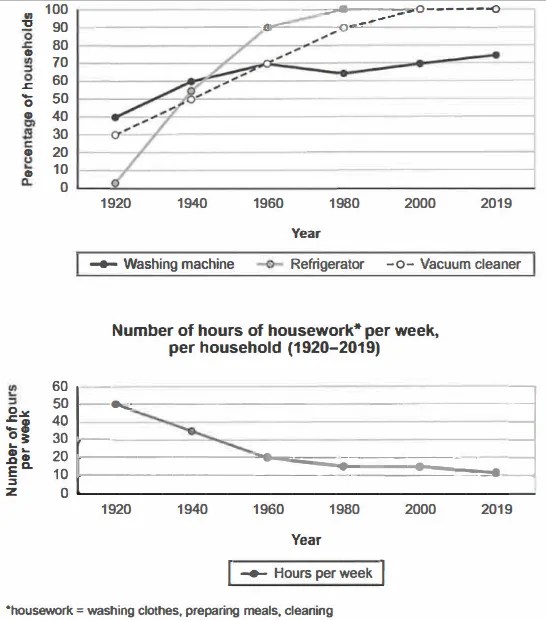
The charts below show the changes in ownership of electrical appliances and amount of time spent doing housework in households in one country between 1920 and 2019.
Summarise the information by selecting and reporting the main features, and make comparisons where relevant.
Percentage of households with electrical appliances (1920-2019)
Student answer (Band 6.0)
The pie-charts illustrates the perference of household machine and time spend doing house work per weak over the periods of ten decades.
It is clearly seen that, all house hold eqipements has rise and time spend in house work has fall drasticaly by the time.
Looking into the picture, the refrigerator and vacuum cleaner was least perferde in 1920 amd then it rose dracticaly till 1940 about 50% of people uses it in that time and then again it shows rise and refrigerator reach 100% in 1980 and vacume cleaner in 2000 and they remain constant till 2019. washing machine was most perferde in first by 40% and rise 60% in 1940 and 70% again in 1960 but then it fall to 60% in 1980 and rise to 70% in 2000 and remain still to 2019.
Similarly, in first people spends theri 50 hours per week doing household work but it fall significently to 1980 by 15 hours per week nad remain constant till 2000 and again end up falling to 10 hours per week by 2019.
AI examiner evaluation
| Criterion | Band |
|---|---|
| Task Achievement / Task Response | 6.5 |
| Coherence and Cohesion | 6.5 |
| Lexical Resource | 5.0 |
| Grammatical Range and Accuracy | 5.0 |
| Overall | 6.0 |
Task Achievement / Task Response: Band 6.5
You identify the main overall contrast: appliance ownership generally increased while time spent on housework declined. You also report several key stages, including refrigerators reaching 100% by 1980 and vacuum cleaners by 2000. This gives the response a relevant overview and covers both charts. Some details, however, are inaccurate or imprecise: refrigerators were at about 2% in 1920, rather than being grouped with vacuum cleaners as simply the least preferred; washing-machine ownership fell to about 65% in 1980, not 60%; and housework was about 11 hours in 2019. The description also says “people” use appliances, although the chart measures households. More precise reporting and a clearer comparison of the different appliance trends would make the account more complete and better supported.
Coherence and Cohesion: Band 6.5
The response has a recognisable structure: an introduction, an overview, and separate discussion of appliance ownership and housework hours. The sequence through the years is generally easy to follow, and linking expressions such as “Similarly” and “but then” help connect information. However, the first body paragraph contains several long, loosely joined clauses, so the comparisons between refrigerators, vacuum cleaners and washing machines are not always easy to track. Some transitions are mechanical, and references such as “it” can be unclear when several appliances are being discussed. Use shorter sentences and organise the appliance trends into clearer comparisons—for example, grouping the two appliances that eventually reached full ownership—while retaining the overall chronological progression.
Lexical Resource: Band 5.0
You use some relevant task vocabulary, including “remain constant,” “rise,” “fall,” and “per week,” so the main trends can be understood. However, the range is limited and several word-choice, collocation and spelling problems make the description less precise. “Pie-charts” misidentifies the visuals, which are line graphs, while “perference” and “perferde” are inaccurate forms. Phrases such as “time spend doing house work” and “most perferde” are not natural ways to describe the data. Aim for accurate chart language and a wider set of trend verbs and comparison phrases, such as “ownership,” “increased steadily,” and “levelled off.” Careful proofreading would also remove distracting spelling errors.
Grammatical Range and Accuracy: Band 5.0
The response attempts both simple statements and longer sentences with time clauses, such as “then it rose … and then again it shows rise.” This shows some effort to connect events, but the range is limited and complex sentences are often faulty. There are recurring problems with subject–verb agreement and verb forms: “the pie-charts illustrates,” “the refrigerator and vacuum cleaner was,” and “people spends.” Tense control is also inconsistent when describing past data, as in “it shows rise,” and articles and plurals are sometimes missing or incorrect. These errors can make parts of the account difficult to read. Practise using accurate past-tense sentences, and divide multi-trend descriptions into shorter clauses with clear subjects and verbs.
See this exact question answered at other band scores. The same prompt compared across bands.
Browse more IELTS Writing model answers or get your own writing scored by the same AI examiner.