Band 6.0 IELTS Writing Task 1 Model Answer
Overall Band Score: 6.0 · Cambridge IELTS 16 · 2026-11-08
IELTS Writing Task 1 question
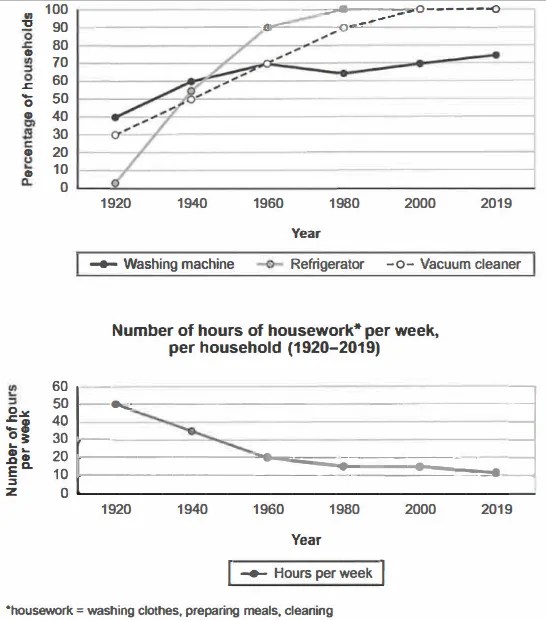
The charts below show the changes in ownership of electrical appliances and amount of time spent doing housework in households in one country between 1920 and 2019.
Summarise the information by selecting and reporting the main features, and make comparisons where relevant.
Percentage of households with electrical appliances (1920-2019)
Student answer (Band 6.0)
the charts illustrate changes in the percentage of households that owned three types of electric appliances such as washing machine ,refrigerator, vacuum cleaner as well as the numbers of hours spending on houseworks like (washing clothes, preparing meals, cleaning) per week between 1920 to 2019.
overall, the ownership of all three electric appliances increased over period.Refrigerators experienced the most significant growth, eventually becoming available in almost every household.in contrast, the number of hours spent on housework decreased .
in 1920, approximately 40% of households owned a washing machine, making it the most common appliance.Meanwhile, around 30% of the majority owned vacuum cleaner but on the contrary, no one owned refrigerator.In 1940 ownership of washing machine and refrigerator had risen to approximately 55% and more than 50%, respectively.The figures continued to increase like, refrigerator reached about 90% in 1960 and almost 100% in 1980 .vacuum cleaner cleaner ownership also grew steadily ,reaching almost 100% in 2000.however, washing machine ownership fluctuated slightly, falling from around less than 70% in 1980 and then it increased 70% in 2000 and more than 70% in 2019.
Regarding housework, the number of hours of housework fell dramatically from approximately 50 hours in 1920 to around 20 hours in 1960. and then it slightly dropped around less than 20 hours in 1980 .However, in 1980 the work hours was steady till 2000 about 15 hours. While ,from 2000 to 2019 it steadily fell around 10%.
AI examiner evaluation
| Criterion | Band |
|---|---|
| Task Achievement / Task Response | 6.5 |
| Coherence and Cohesion | 6.0 |
| Lexical Resource | 5.5 |
| Grammatical Range and Accuracy | 5.5 |
| Overall | 6.0 |
Task Achievement / Task Response: Band 6.5
You cover both charts and provide a clear overview: appliance ownership generally rose, while housework time fell. You also identify important comparisons, including refrigerators’ rapid rise and washing-machine ownership’s slight dip. Most reported figures are broadly consistent with the chart, but there are a few inaccuracies: refrigerators were at about 2% in 1920, not zero, and washing-machine ownership was about 60% in 1940 rather than 55%. The final housework figure is approximately 11 hours, not 10%. The overview is relevant, though it could be more precise by noting that refrigerators and vacuum cleaners both reached 100%, and that housework fell to around 11 hours by 2019. This covers the task well, with some details and comparisons needing greater precision.
Coherence and Cohesion: Band 6.0
The response has a recognisable structure: an introduction, an overview, and separate detail sections for appliance ownership and housework. This makes the main information easy to locate. However, progression within the appliance paragraph is sometimes difficult to follow because several years and series are compressed together, as in “The figures continued to increase like” before the refrigerator and vacuum-cleaner details. Some linking words are awkward or overused, including “Meanwhile,” “on the contrary,” “however,” and “While,” and the final paragraph’s sentence beginning “and then” is not smoothly connected to the previous point. Grouping the appliance trends more systematically and using simpler, more accurate transitions would make the relationships clearer.
Lexical Resource: Band 5.5
You use relevant task vocabulary such as “ownership,” “fluctuated,” “steadily,” and “decreased,” which helps describe trends and comparisons. There is some range, but several word choices and collocations are inaccurate or repetitive, limiting precision. For example, “hours spending on houseworks” and “the work hours” are not natural ways to describe the measure, while “no one owned refrigerator” is too absolute for the chart. “The figures continued to increase like” is also an imprecise phrase, and “almost every household” could be replaced with a more exact description of the 100% figures. Aim for standard chart language such as “the proportion of households owning…” and “weekly housework hours,” and check spelling and spacing, including “housework” and “vacuum cleaner.”
Grammatical Range and Accuracy: Band 5.5
You attempt both simple and more complex sentences, including clauses introduced by “while” and “however,” and the overall meaning is generally understandable. Some grammatical errors remain, particularly with articles, plurals, verb forms, and sentence boundaries. Examples include “owned washing machine” instead of “owned a washing machine,” “the number of hours … decreased” rather than “the numbers,” and “the work hours was steady” rather than “the number of hours was steady.” Several sentences begin with lowercase words after full stops, and punctuation around transitions is inconsistent. The sentence “While, from 2000 to 2019…” is also incomplete. Review article use and subject–verb agreement, and make sure each sentence has a complete main clause.
See this exact question answered at other band scores. The same prompt compared across bands.
Browse more IELTS Writing model answers or get your own writing scored by the same AI examiner.