Band 5.5 IELTS Writing Task 1 Model Answer
Overall Band Score: 5.5 · Cambridge IELTS 16 · 2026-11-08
IELTS Writing Task 1 question
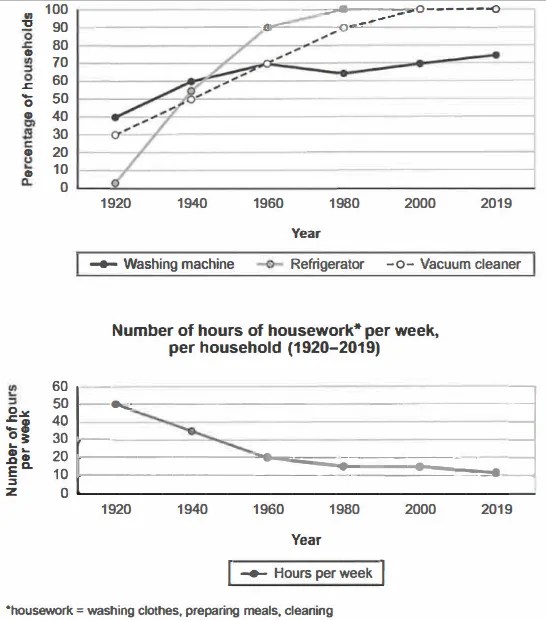
The charts below show the changes in ownership of electrical appliances and amount of time spent doing housework in households in one country between 1920 and 2019.
Summarise the information by selecting and reporting the main features, and make comparisons where relevant.
Percentage of households with electrical appliances (1920-2019)
Student answer (Band 5.5)
The charts depicts the changes in ownership of digital gadgets and total time spent doing housework in households in one nation from 1920 to 2019.ecame steady in 1080
Overall, the percentage of households with electrical appliances grew steadily from time to time. However, the number of hours of housework per week, per household began to decline throughout these period of time. Mainly, the home related works are divided into three parts, for example washing clothes, preparing meals and cleaning.
Firstly, refrigerator remained as the lowest in 1920 but it jumped to 100 percent in 2000 and remained steady till 2019. However, vaccum cleaner was moderately 30 percent in 1920, though, it hiked to 100 percent in 2019 respectively. Moreover, washing machine was the higest in 1920 at about 40 percent but it did not grow as expected and reached its peak about 70 percent in 2019.
On the other hand, numbers of working per hour began to decline since from 1920 to till 2019. At its peak, it was 50 hours per week but after that it showed heavy downfall till 1960 and at last it became steady from 1980 to 2019.
as to conclude, percentage of household remained growing but working hours showed massive downfall from the beginning.
AI examiner evaluation
| Criterion | Band |
|---|---|
| Task Achievement / Task Response | 6.0 |
| Coherence and Cohesion | 6.0 |
| Lexical Resource | 5.5 |
| Grammatical Range and Accuracy | 5.0 |
| Overall | 5.5 |
Task Achievement / Task Response: Band 6.0
You cover both charts and give a relevant overall summary: appliance ownership generally increased, while weekly housework hours fell. Several key figures are accurately reported, including the refrigerator’s rise from about 2% to 100%, the vacuum cleaner’s increase from 30% to 100%, and the initial 50 hours of housework. However, some important details are incomplete or imprecise. The refrigerator reached 100% by 1980, not 2000, and the washing-machine figure dipped from 70% in 1960 to 65% in 1980 before rising again. The claim that appliance ownership grew steadily overlooks this fluctuation. You also say housework was steady from 1980 to 2019, although it fell from 15 to 11 hours. More precise comparisons and coverage of these changes would strengthen the report.
Coherence and Cohesion: Band 6.0
The response has a recognisable structure, with an introduction, an overview, separate discussion of appliance ownership and housework, and a concluding sentence. This makes the main direction of the data easy to follow. However, the conclusion largely repeats the overview, and some transitions are mechanical or confusing: “Firstly,” “However,” and “On the other hand” do not always show a clear contrast between the information being compared. The appliance paragraph would be easier to follow if the three series were compared in a consistent order and their key changes grouped together. The opening also contains a stray fragment, “ecame steady in 1080,” which interrupts the progression. Clearer paragraph links and more precise referencing would make the organisation smoother.
Lexical Resource: Band 5.5
You use enough topic vocabulary to communicate the main trends, including “percentage,” “remained,” “decline,” and “peak.” There are also attempts at more descriptive language, such as “hiked” and “heavy downfall,” but these are not natural choices for describing chart data. Several spelling errors—“vaccum,” “higest,” and “ecame”—and imprecise phrases such as “numbers of working per hour” reduce accuracy and sometimes make the meaning less clear. “Digital gadgets” is also less appropriate than “electrical appliances,” the category shown in the chart. Aim for accurate, conventional trend language and check spelling; this will help you express comparisons more precisely without relying on awkward or exaggerated wording.
Grammatical Range and Accuracy: Band 5.0
You attempt both simple and more complex sentences, including a contrast clause in “washing machine was the higest in 1920 … but it did not grow as expected.” The overall meaning is usually recoverable, but some grammatical errors remain. The opening has a sentence fragment, “ecame steady in 1080,” and the introduction has subject–verb disagreement in “The charts depicts.” Other examples include “throughout these period of time,” where the demonstrative and noun do not agree, and “began to decline since from 1920 to till 2019,” where the time construction is faulty. The final sentence also lacks a clear grammatical connection between its two clauses. Use simpler, well-controlled time expressions and check agreement, articles, and sentence boundaries while retaining some varied structures.
See this exact question answered at other band scores. The same prompt compared across bands.
Browse more IELTS Writing model answers or get your own writing scored by the same AI examiner.