Band 5.5 IELTS Writing Task 1 Model Answer
Overall Band Score: 5.5 · Cambridge IELTS 16 · 2026-11-09
IELTS Writing Task 1 question
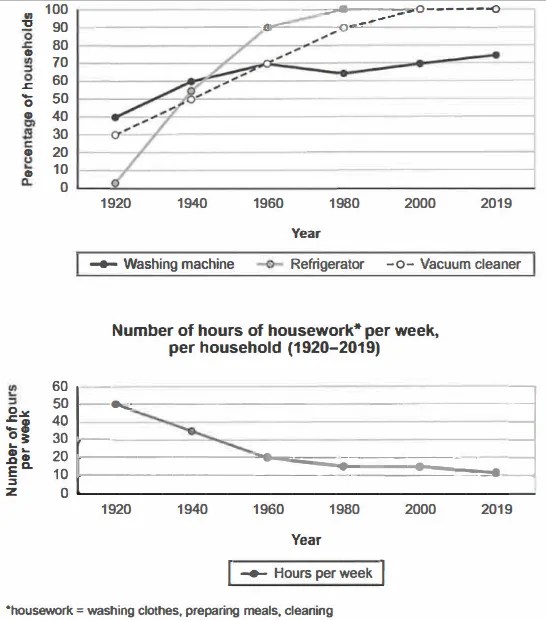
The charts below show the changes in ownership of electrical appliances and amount of time spent doing housework in households in one country between 1920 and 2019.
Summarise the information by selecting and reporting the main features, and make comparisons where relevant.
Percentage of households with electrical appliances (1920-2019)
Student answer (Band 5.5)
The given charts helps us calculate the estimated number of households with the latest electrical appliances and the amount of time the consumers spend on it every week.
From the given charts we can illustrate that revolution in electrical appliances brought a drastic change in people's life, thus reducing their efforts and saving their precious time. The number of hours spent on housework weekly was at it's peak in 1920 and it kept decreasing since then.
The refrigerators how a constant growth since 1920 until 1980 with going constant until 2019, which helps us illustrate that since 1980, the luxury of using refrigerators has been turned into neccesity. The vacuum cleaner seems to be life-saving applicance, it also shows a similar growth as refrigerator sinch 1920 until 2000.
The number of washing machines is almost similar to other appliances until 1960. But unlike refrigeratos and cleaners, it is still not widely used today.
AI examiner evaluation
| Criterion | Band |
|---|---|
| Task Achievement / Task Response | 5.5 |
| Coherence and Cohesion | 6.0 |
| Lexical Resource | 5.5 |
| Grammatical Range and Accuracy | 5.5 |
| Overall | 5.5 |
Task Achievement / Task Response: Band 5.5
You identify the broad relationship between appliance ownership and housework, and you correctly note that refrigerator ownership levels off after 1980. However, the overview is general and some comparisons are inaccurate or unclear. The hours of housework fell from 50 to 11 per week, but describing 1920 as the “peak” does not explain the overall decline or the later plateau around 1980–2000. You also say washing machines were “almost similar” to the other appliances until 1960, although their figures differ substantially in 1920 and 1940. The claim that washing machines are “not widely used today” conflicts with the chart’s 75% figure. Include key figures and make the main trends more precise.
Coherence and Cohesion: Band 6.0
The response has a recognisable structure: an introduction, a broad overview, and separate discussion of refrigerators, vacuum cleaners and washing machines. This gives the reader a basic route through the information. Some links between ideas are also clear, such as “But unlike” when contrasting washing machines with the other appliances. However, the overview and detail are not fully integrated, and the final paragraph ends without a clear concluding comparison. Phrases such as “From the given charts” are repeated or formulaic, while “which helps us illustrate” makes the relationship between the data and the writer’s comment less direct. Organise the body around the main trends, and use clearer references and comparisons to guide the reader.
Lexical Resource: Band 5.5
You use some relevant topic vocabulary, including “constant growth,” “decreasing,” “widely used” and “necessity,” and the general meaning is usually understandable. There is also an attempt to vary expression with phrases such as “drastic change” and “life-saving appliance.” However, several choices are imprecise or unnatural for describing chart data: “calculate the estimated number” does not fit percentages, and “the number of washing machines” should refer to household ownership. Spelling errors such as “neccesity,” “applicance” and “refrigeratos” are noticeable, and “life-saving” overstates what the chart shows. Prefer precise terms such as “the proportion of households” and “ownership rose,” and check spelling and collocations.
Grammatical Range and Accuracy: Band 5.5
You attempt a mixture of simple and complex sentences, including a relative clause in “which helps us illustrate” and a contrast introduced by “But unlike.” Most sentences remain understandable, but some grammatical errors reduce accuracy. The opening has subject–verb disagreement in “charts helps,” and “at it’s peak” uses the wrong form of the possessive. In “The refrigerators how a constant growth,” the verb is missing or malformed, making the sentence difficult to follow. The construction “since 1920 until 1980 with going constant” is also not grammatically controlled. Use accurate past-tense verbs for the historical data, for example, “Refrigerator ownership rose from about 2% in 1920 to 100% in 1980, then remained stable.”
See this exact question answered at other band scores. The same prompt compared across bands.
Browse more IELTS Writing model answers or get your own writing scored by the same AI examiner.