Band 6.0 IELTS Writing Task 1 Model Answer
Overall Band Score: 6.0 · Cambridge IELTS 16 · 2026-11-09
IELTS Writing Task 1 question
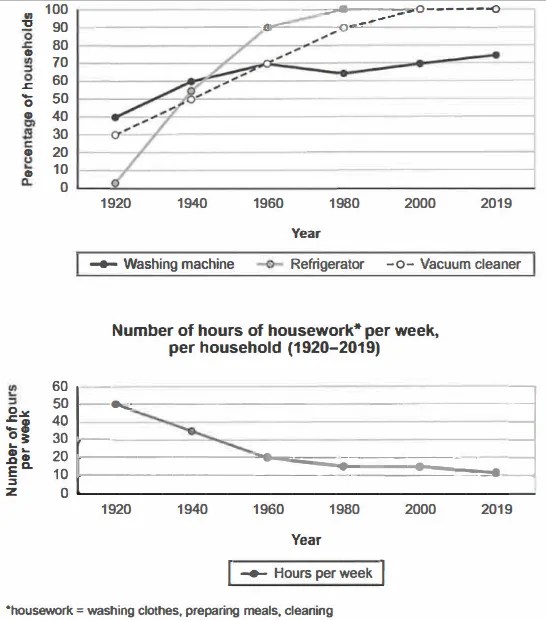
The charts below show the changes in ownership of electrical appliances and amount of time spent doing housework in households in one country between 1920 and 2019.
Summarise the information by selecting and reporting the main features, and make comparisons where relevant.
Percentage of households with electrical appliances (1920-2019)
Student answer (Band 6.0)
The line graphs illustrate the variations in ownership of electrical devices and calculated hours that has spent performing homechores in one country from 1920 to 2019.Overall, the percentage of all three electrical household gadgets are increasing. Whereas, number of hours of household chores per week are decreasing.
Graph 1 demonstrates the percentage of households that have washing machine, refrigerator and vacuum cleaner from 1920 to 2019. In 1920, refrigerator was at 0% and then it has boomed to 90% in 1960 and rose to 100% and continues its position.While,washing machine and vacuum cleaner started from 40% and 30% in 1920, rose to 70% to 100% by 1960 .However, the fluctuation can be seen in washing machines.
Graph 2 represents the number of hours per week every household works is showing downward trend started from 50 hours per week in 1920 to 15 hours approximately in 1980 and then it is continued and has ended up at hours per week in 2019.
AI examiner evaluation
| Criterion | Band |
|---|---|
| Task Achievement / Task Response | 6.0 |
| Coherence and Cohesion | 6.0 |
| Lexical Resource | 6.0 |
| Grammatical Range and Accuracy | 5.0 |
| Overall | 6.0 |
Task Achievement / Task Response: Band 6.0
You identify the two broad trends: appliance ownership generally rises, while weekly housework time falls. You also include several relevant figures, such as washing machines at 40% in 1920 and housework at 50 hours initially. However, some key details are inaccurate or incomplete. Refrigerator ownership was about 2% in 1920, not 0%, and reached 90% in 1960; the washing-machine and vacuum-cleaner figures did not both rise to 100% by 1960. The washing-machine series fluctuated, but its dip to about 65% in 1980 and later recovery are not explained. The final housework figure is omitted, and the overview could more clearly note that refrigerators and vacuum cleaners reached 100%. More precise comparisons would make the summary fuller.
Coherence and Cohesion: Band 6.0
The response has a recognisable structure: an introduction and overview are followed by separate paragraphs for the two graphs. This gives the reader a coherent overall route through the information. Some links between ideas are less clear, however. In the appliance paragraph, “While” and “However” are used in ways that do not clearly show the intended comparison, and the sentence combining the starting values with later changes is difficult to follow. The overview also uses “Whereas” as a sentence fragment rather than connecting it to the preceding statement. Use clearer transitions such as “By contrast” and organise each appliance’s trend in a distinct clause. This would make the progression smoother and the relationships between figures easier to understand.
Lexical Resource: Band 6.0
You use a reasonable range of vocabulary for describing trends, including “illustrate,” “ownership,” “boomed,” “fluctuation,” and “downward trend.” These choices show an attempt to vary your language, and the main meaning is generally understandable. Some expressions are imprecise or unnatural for an academic chart summary: “electrical devices” and “household gadgets” are less exact than “appliances,” while “calculated hours” and “works” do not clearly describe time spent on housework. “Boomed” is also too informal for this context. Aim for accurate collocations such as “the proportion of households owning” and “hours spent doing housework.” More consistent, precise wording would strengthen the report.
Grammatical Range and Accuracy: Band 5.0
You attempt both simple and more complex sentence forms, including a contrast with “Whereas” and a relative clause in “hours per week every household works.” However, some grammatical errors make parts of the report unclear. In the introduction, “hours that has spent” has an incorrect verb form and agreement; “the percentage … are increasing” also has subject–verb disagreement. Articles and plurals are missing in phrases such as “have washing machine,” and the final sentence ends with “at hours per week,” omitting the number. Punctuation spacing and sentence boundaries are inconsistent, particularly around “Overall” and “While.” Check agreement, complete verb phrases, and ensure each sentence has a clear grammatical structure.
See this exact question answered at other band scores. The same prompt compared across bands.
Browse more IELTS Writing model answers or get your own writing scored by the same AI examiner.