Band 6.0 IELTS Writing Task 1 Model Answer
Overall Band Score: 6.0 · Cambridge IELTS 16 · 2026-11-09
IELTS Writing Task 1 question
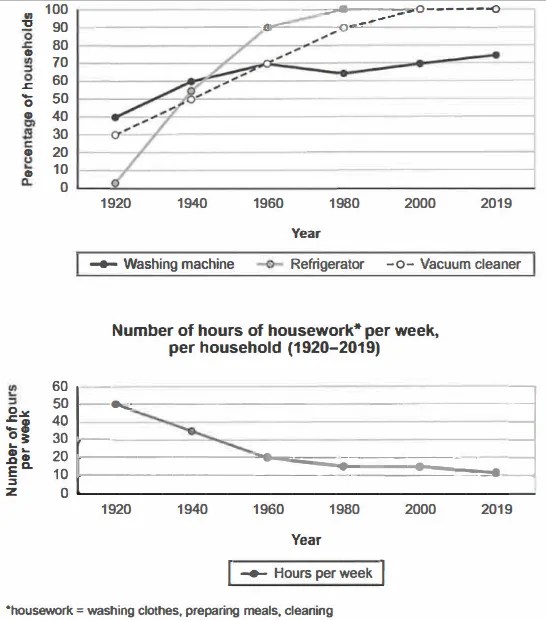
The charts below show the changes in ownership of electrical appliances and amount of time spent doing housework in households in one country between 1920 and 2019.
Summarise the information by selecting and reporting the main features, and make comparisons where relevant.
Percentage of households with electrical appliances (1920-2019)
Student answer (Band 6.0)
The line charts compares the percentage of households and the number of hours per week in a household from 1920 to 2019.
It is evident that the highest percentage of households was the Vacuum cleaner. Meanwhile, the most number of hours doing housework was at peak in 1920.
In terms of households, the highest percentage of electrical appliances used in 1920 was Washing machine. Over the next 20-year period, it remained the highest but in 1960 Refrigerator was the highest percentage with 90% among electrical items. Moreover, Vacuum cleaner was increasing at a rapid pace and during [redacted phone], it was the highest with 100% ownership of electrical appliances in households.
Regarding the housework, the figure for number of hours per week doing house chores was at 50 hours in 1920, but it kept declining from 1940 to 1980. However, it remained steady throughout 1980 to 2000. It is notable, during that period of 20 years it was just above 10 hours per week. Nonetheless, by the end of 2019, it was exactly at 10 hours per week.
AI examiner evaluation
| Criterion | Band |
|---|---|
| Task Achievement / Task Response | 5.5 |
| Coherence and Cohesion | 6.0 |
| Lexical Resource | 6.0 |
| Grammatical Range and Accuracy | 5.5 |
| Overall | 6.0 |
Task Achievement / Task Response: Band 5.5
You identify the broad contrast between rising appliance ownership and falling housework time, and you include relevant figures such as 50 hours in 1920 and refrigerator ownership reaching 90% in 1960. However, the overview is not fully accurate: calling the vacuum cleaner the highest overall overlooks the refrigerator’s 100% ownership from 1980 onward, while the washing machine reaches only 75% by 2019. The appliance description also misstates the 1920 ranking: washing machines were highest, but the vacuum cleaner was not discussed as the next comparison, and the refrigerator was only about 2%. The housework trend is mostly covered, though 2019 is approximately 11 hours, not exactly 10. Select the main trends more precisely and compare all three appliances across the period.
Coherence and Cohesion: Band 6.0
The response has a coherent overall arrangement: an introduction, a brief overview, and separate paragraphs for appliance ownership and housework. This makes the two charts easy to follow, and transitions such as “Meanwhile,” “Moreover,” and “Regarding” signal changes in focus. However, some connections are mechanical or unclear. “It remained the highest” does not clearly identify which appliance “it” refers to, and the overview’s claim about the vacuum cleaner is not well connected to the later comparison. The appliance paragraph also moves through selected years without a consistently clear comparison among the three series. Use more precise referencing and organise the appliance data around shared milestones, such as the rise to full ownership and the washing machine’s slower growth.
Lexical Resource: Band 6.0
You use an adequate range of vocabulary for describing trends, including “declining,” “remained steady,” “increasing at a rapid pace,” and “ownership.” These choices help communicate the main movements, and the meaning is generally clear. Some expressions are imprecise or unnatural for a data report, however. “The highest percentage of households was the Vacuum cleaner” confuses the appliance with the percentage, while “the most number of hours” and “at peak” are awkward collocations. “Electrical appliances used” is also less precise than describing household ownership. Aim for concise, conventional chart language and avoid repeating “percentage” where a direct comparison or figure would be clearer. More accurate vocabulary would also help distinguish ownership levels from the appliances themselves.
Grammatical Range and Accuracy: Band 5.5
You use a mix of simple and more complex sentence forms, including contrast clauses with “but” and time clauses such as “during 2000–2019.” Most sentences remain understandable, but some grammatical errors and awkward constructions reduce precision. The opening “The line charts compares” has a subject–verb agreement error; it should be “The line charts compare.” In “the most number of hours doing housework was at peak,” the noun phrase and sentence structure are faulty. The sentence beginning “It is notable, during that period…” also needs a clearer grammatical connection, for example, “Notably, during this 20-year period, the figure was…” Check agreement, articles, and sentence boundaries, and build complex sentences around clear subjects and verbs.
See this exact question answered at other band scores. The same prompt compared across bands.
Browse more IELTS Writing model answers or get your own writing scored by the same AI examiner.