Band 6.0 IELTS Writing Task 1 Model Answer
Overall Band Score: 6.0 · Cambridge IELTS 16 · 2026-11-10
IELTS Writing Task 1 question
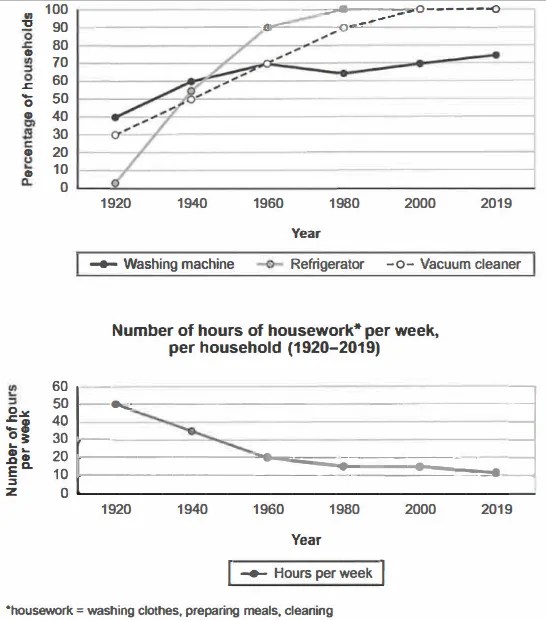
The charts below show the changes in ownership of electrical appliances and amount of time spent doing housework in households in one country between 1920 and 2019.
Summarise the information by selecting and reporting the main features, and make comparisons where relevant.
Percentage of households with electrical appliances (1920-2019)
Student answer (Band 6.0)
The line chart illustrate the changes in ownership of three electrical appliances and the amount of weekly time spent on housework in a single country between 1920 and 2019.
By statistical overview, the ownership of all three electrical appliances rose substantially over the period of time, while the weekly time spent on housework dramatically decreased. Vacuum cleaner and Refrigerator recorded by far the highest proportion, followed by washing machine ownership which gradually increased.
In 1920, around 40% households owned washing machines, 30% owned vacuum cleaner and none of washing machine. By 1940, washing machine reached at 60%, while Refrigerator and Vacuum cleaner stood at 50%. Refrigerator ownership then climbed rapidly to 90% in 1960 and recorded highest propotion of 100% in 2019. Vacuum cleaner ownership also increased steadily, which achieved full ownership in 2019. Washing machine rose to about 70% in 1960, which dropped to almost 50% in 1980 and ended at rughly 65% by 2019.
Meanwhile, weekly housework fell from about 50 hours in 1920 to 35 hours in 1940 and 20 hours in 1960. It then declined further to around 15 hours in 1980 and 2000, before reaching approximately 10 hours in 2019
AI examiner evaluation
| Criterion | Band |
|---|---|
| Task Achievement / Task Response | 6.0 |
| Coherence and Cohesion | 6.5 |
| Lexical Resource | 6.0 |
| Grammatical Range and Accuracy | 5.5 |
| Overall | 6.0 |
Task Achievement / Task Response: Band 6.0
You identify the main overall contrast: appliance ownership generally increased while housework time fell, and you include relevant figures across the period. However, several details are inaccurate or unclear. In 1920, refrigerators were owned by about 2% of households, not “none of washing machine”; this also repeats washing-machine ownership rather than naming the correct appliance. The washing-machine figure falls to about 65% in 1980, not “almost 50%,” and ends at about 75%, rather than roughly 65%. Your overview also says vacuum cleaners and refrigerators had the highest proportions, but does not clearly capture that refrigerators reached 100% by 1980 and vacuum cleaners by 2000. More precise reporting of these key comparisons would make the response more complete and reliable.
Coherence and Cohesion: Band 6.5
The response has a clear overall arrangement: an introduction, a summary of the main trends, a paragraph on appliance ownership, and a final paragraph on housework. The sequence from earlier to later years is easy to follow, and transitions such as “By 1940,” “Meanwhile,” and “It then” help connect information. This already gives the report a coherent progression. To make the organisation more effective, ensure each comparison is expressed clearly and avoid placing unrelated or contradictory details in the same sentence. For example, the 1920 ownership figures and the later washing-machine decline are difficult to interpret because of inaccurate wording and figures. More consistent use of precise references to each appliance would also strengthen cohesion.
Lexical Resource: Band 6.0
You use a suitable range of trend vocabulary, including “rose substantially,” “climbed rapidly,” “increased steadily,” and “declined further.” These choices help describe changes rather than simply list figures, and the meaning is generally clear. However, some word choices and collocations are inaccurate or awkward, such as “By statistical overview,” “recorded highest proportion,” and “reached at 60%.” There are also spelling errors in “propotion” and “rughly,” which reduce accuracy. Aim for natural, precise expressions commonly used in data reports, and check spelling carefully. Using terms such as “accounted for,” “stood at,” and “reached a peak” would make descriptions more fluent and appropriately formal.
Grammatical Range and Accuracy: Band 5.5
You attempt a mix of simple and complex sentence forms, including clauses with “while,” “which,” and “before,” and most of the report remains understandable. Some grammatical errors are present, however. The opening should be “The line chart illustrates,” with subject–verb agreement, and “40% households” needs the article “of” (“40% of households”). In “reached at 60%,” the preposition is not needed, while “which dropped” has an unclear reference and should be recast as a direct statement about washing-machine ownership. The phrase “none of washing machine” is also grammatically incomplete. Review articles, agreement, and sentence references, and aim to make complex sentences accurate as well as varied.
See this exact question answered at other band scores. The same prompt compared across bands.
Browse more IELTS Writing model answers or get your own writing scored by the same AI examiner.