Band 6.0 IELTS Writing Task 1 Model Answer
Overall Band Score: 6.0 · Cambridge IELTS 16 · 2026-11-10
IELTS Writing Task 1 question
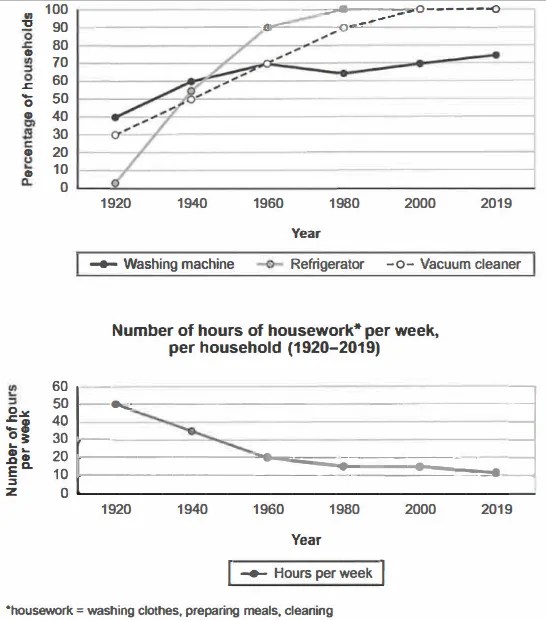
The charts below show the changes in ownership of electrical appliances and amount of time spent doing housework in households in one country between 1920 and 2019.
Summarise the information by selecting and reporting the main features, and make comparisons where relevant.
Percentage of households with electrical appliances (1920-2019)
Student answer (Band 6.0)
The given chart illustrates a data of a country between 1920 and 2019. It is showing the changes in possession of electrical appliances and amount of time which is spent doing housework in homes.
Overall, the data is showing the use of waching machines, refrigerators and vaccum cleaners.Additionally, another graph is demonstrating number of hours spent per week for houseworks doing wasing clothes, preparing meals and cleaning.
In the first diagrame, at 1920, no one was using refrigetor in the houses. After this, till 1960, there was a sharp increase and the useage of refrigerator went upto 90 percent and then in the 1980 turned into 100 percent usage and till today maintaining this result. Washing machine started by 40 percent in 1920 amd still standing at 70 percent. Vacuum cleaner ownership rised from 30 percent in 1920 and showed a sharp increase untll 2000 at 100 percent useage and still maintaining this position.
A drastically decline can be seen in number of hours per week in the housework in the second chart. In 1920, 50 percent of the day was spent in washing clothes, preparing meals and cleaning. But now, only 10 percent of the day is used in these housework tasks.
AI examiner evaluation
| Criterion | Band |
|---|---|
| Task Achievement / Task Response | 6.0 |
| Coherence and Cohesion | 6.5 |
| Lexical Resource | 5.5 |
| Grammatical Range and Accuracy | 5.5 |
| Overall | 6.0 |
Task Achievement / Task Response: Band 6.0
You identify the main overall pattern: appliance ownership generally rose while time spent on housework fell, and you report several key figures, including refrigerators reaching 100% by 1980 and vacuum cleaners reaching full ownership by 2000. However, some details are inaccurate or unclear. Refrigerators were at about 2%, not zero, in 1920; washing-machine ownership rose to 70% by 1960, dipped to 65% in 1980, and ended at 75%, rather than “still standing at 70 percent.” The housework figures are hours per week, not percentages of the day: they fell from 50 to about 11 hours. The overview also mainly describes what the charts show rather than summarising their most important trends. More precise comparisons and a clearer account of the washing-machine fluctuation would make the report more complete.
Coherence and Cohesion: Band 6.5
The response has a recognisable structure: an introduction, an overview, a paragraph on appliance ownership, and a final paragraph on housework. This gives the reader a generally logical route through the information, and transitions such as “After this” and “Additionally” help connect points. To strengthen progression, make the overview state the key contrasts directly, then group related appliance trends together and compare their endpoints. Some links are vague or repetitive: “still maintaining this result” and “still maintaining this position” repeat the same idea without adding information. The final paragraph also shifts from hours per week to “percent of the day,” which disrupts the comparison. Clearer referencing and more purposeful linking would make the organisation more fluent.
Lexical Resource: Band 5.5
You use relevant chart vocabulary, including “sharp increase,” “ownership,” “decline,” and “per week,” and the reader can generally understand the trends you intend to describe. However, word choice and spelling are often inaccurate, which limits precision: “possession” is less natural than “ownership” in this context, while “usage” does not clearly describe the percentage of households owning an appliance. There are also repeated misspellings, such as “waching,” “vaccum,” “refrigetor,” and “diagrame.” Some phrases are awkward or imprecise, including “the useage … went upto” and “houseworks doing.” Aim for accurate chart collocations and check spelling carefully; this will make your descriptions more concise and reliable.
Grammatical Range and Accuracy: Band 5.5
You attempt both simple and more complex sentence forms, for example, “After this, till 1960, there was a sharp increase…” and “A drastically decline can be seen…”. The main trends remain understandable, but some grammatical errors recur. Articles and noun forms are problematic in “illustrates a data” and “in the housework”; the latter also needs a more suitable construction. Tense and sentence structure are uneven: “Washing machine started by 40 percent … and still standing at 70 percent” lacks a clear, correctly formed verb pattern. The long appliance sentence also joins several stages without clear punctuation. Use complete clauses with consistent past-tense reporting, and check articles, plurals, and sentence boundaries to improve accuracy.
See this exact question answered at other band scores. The same prompt compared across bands.
Browse more IELTS Writing model answers or get your own writing scored by the same AI examiner.