Band 5.0 IELTS Writing Task 1 Model Answer
Overall Band Score: 5.0 · Cambridge IELTS 16 · 2026-11-11
IELTS Writing Task 1 question
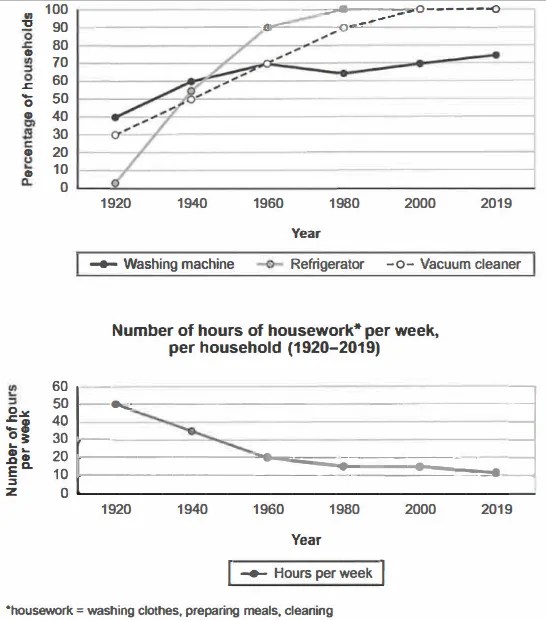
The charts below show the changes in ownership of electrical appliances and amount of time spent doing housework in households in one country between 1920 and 2019.
Summarise the information by selecting and reporting the main features, and make comparisons where relevant.
Percentage of households with electrical appliances (1920-2019)
Student answer (Band 5.0)
The given chart show the changes in ownership of electrical appliance and amount of time spent doing household between 1920 and 2019 in one country. The graph of all equipment rise during whole years.
First, we discus about washisng machine during 1920 the ownership of this appliance is 40% and it goes to 60% in 1940. Furthermore it goes to about 72% at the end (in 2019)
second,The graph of refrigerator is also goes upward during whole years in 1920 the ownership of this appliance is 30% and it goes up gradually. In 1960 its ownership is 90% in 2000 ownership is 100% and remain same till end.
Third, the ownership of Vacuum cleaner is 0% in starting and there is an big increace in their ownership in 1940 ownership is almost 53% and it reaches to 90% in 1960 . During 1980 it reaches to 100% however it reamain same till end.
The lower chart tell us that there is a big decease number of hours per week
. In 1920 number of hours per week is 50 which decease gradually and it reaches too 20 hours per week at the end it remain only 10 hours per week.
AI examiner evaluation
| Criterion | Band |
|---|---|
| Task Achievement / Task Response | 5.0 |
| Coherence and Cohesion | 5.5 |
| Lexical Resource | 5.0 |
| Grammatical Range and Accuracy | 5.0 |
| Overall | 5.0 |
Task Achievement / Task Response: Band 5.0
You cover both charts and identify the broad contrast: appliance ownership generally rises, while weekly housework time falls. Several figures are reported, including washing machines at 40% in 1920 and refrigerators reaching 100% by 2000. However, important details are inaccurate: refrigerators began at about 2%, not 30%, and vacuum cleaners were about 70% in 1960 and reached 100% in 2000, rather than 90% and 100% in 1960 and 1980. The housework figure of 20 hours is for 1960, not the end of the period. The response also lacks a clear overview of the main comparisons and gives limited detail on the later housework trend. Check each series against the chart and summarise the key patterns before listing figures.
Coherence and Cohesion: Band 5.5
The response has some organisation: it moves from washing machines to refrigerators, vacuum cleaners, and then housework, with paragraph breaks separating the topics. Sequencing words such as “First,” “second,” and “Third” help signal this order. However, the progression is mostly a list of separate observations rather than a connected summary, and there is no distinct overview to guide the reader. Some links are mechanical or unclear, such as “Furthermore” and “however,” while the final paragraph’s sentence break before “In 1920” interrupts the flow. Group the appliance trends together, then describe the housework trend, using comparisons and clear links between related changes.
Lexical Resource: Band 5.0
You use relevant chart vocabulary, including “ownership,” “reaches,” “gradually,” and “hours per week,” so the topic is generally understandable. However, the range is limited and several word-choice, spelling, and collocation errors make the report less precise: “the graph of all equipment rise,” “big increace,” and “big decease number” are awkward or incorrect. “Household” is also confused with “housework” in the opening. Repeated use of “goes,” “ownership,” and “reaches” makes the description sound repetitive. Build a small set of accurate trend expressions, such as “rose steadily,” “levelled off,” and “declined,” and check spelling and word forms before submitting.
Grammatical Range and Accuracy: Band 5.0
The response mainly uses simple statements and attempts a few longer sentences, but control is inconsistent. Errors occur in subject–verb agreement and verb forms, for example, “The given chart show” and “the graph … is also goes upward.” Articles and sentence construction are also problematic in “there is an big increace,” while punctuation and capitalisation are uneven, particularly after “second” and around the final paragraph break. These errors sometimes make relationships between ideas harder to follow. Practise accurate simple past forms for the historical data and use a few controlled complex sentences with “while,” “whereas,” or “by.” Proofread each sentence for agreement, articles, and punctuation.
See this exact question answered at other band scores. The same prompt compared across bands.
Browse more IELTS Writing model answers or get your own writing scored by the same AI examiner.