Band 5.0 IELTS Writing Task 1 Model Answer
Overall Band Score: 5.0 · Cambridge IELTS 16 · 2026-11-11
IELTS Writing Task 1 question
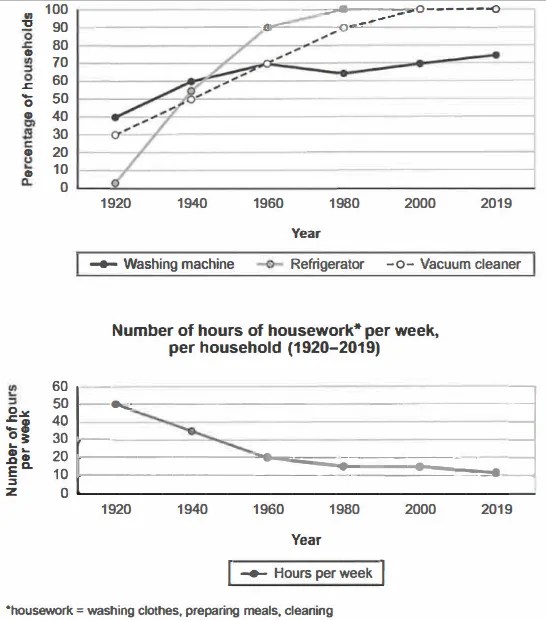
The charts below show the changes in ownership of electrical appliances and amount of time spent doing housework in households in one country between 1920 and 2019.
Summarise the information by selecting and reporting the main features, and make comparisons where relevant.
Percentage of households with electrical appliances (1920-2019)
Student answer (Band 5.0)
The chart shows the changes in ownership of electrical appliances and amount of time spent doing housework in households in one country. The household work includes, washing machine, preparing meals and cleaning. Two charts and categories are given. The percentage of household starts from 0 to 100. And the number of year starts from 1920 to 2019. Three categories are given. They are washing machine, refrigerator and vacuum cleaner.
In 1920, the percentage of refrigerator used were 0, 30% of vacuum cleaners were used and 40% of washing machines was used. In 1940, 50% of vacuum cleaners was used, 51% of refrigerators and 60% of washing machines was used. In 1960, 70% of vacuum cleaners and washing machines were used and 90% of refrigerators. In 1980, 61% of washing machines were used, 90% of vacuum cleaner was used and 100% of refrigerator were used. In 2000, 70% of washing machines were used and 100% of vacuum cleaner and refrigerator were used. In 2019, 71% of washing machines were used and refrigerators and vacuum cleaner were used 100% with same ratio.
The second chart shows information about number of hours of housework. The years starts from 1920 to 2019. In 1920, the number of hours doing housework per week was 50. In 1940, the number of hours doing housework per week was 33. In 1960, the number of hours doing housework per week was 20. In 1980, the number of hours doing housework per week was 12. In 2000, the number of hours doing housework per week was 11. In 2019, the number of hours doing housework per week was 10. The number of hours were decreasing by the time changes.
AI examiner evaluation
| Criterion | Band |
|---|---|
| Task Achievement / Task Response | 5.0 |
| Coherence and Cohesion | 5.5 |
| Lexical Resource | 5.0 |
| Grammatical Range and Accuracy | 5.0 |
| Overall | 5.0 |
Task Achievement / Task Response: Band 5.0
You cover both charts and report the broad pattern that appliance ownership rose while housework hours fell. However, the response is mainly a sequence of year-by-year figures rather than a clear summary of the most important features, and it lacks a distinct overview. Several figures are inaccurate: refrigerator ownership was about 2% in 1920, not 0%; it was about 55% in 1940, not 51%; and washing-machine ownership was about 65% in 1980 and 75% in 2019, rather than 61% and 71%. Housework was about 15 hours in both 1980 and 2000, not 12 and 11. The final sentence gives a useful overall trend, but should also highlight that refrigerators and vacuum cleaners reached full ownership. Prioritise these comparisons and check figures against the chart.
Coherence and Cohesion: Band 5.5
The response has a basic, understandable structure: it introduces the appliance chart, reports its figures, then moves to the housework chart. This separation helps readers follow the two topics. However, progression within the response is largely a repetitive list of years and values, with little grouping or comparison between trends. Phrases such as “In 1920” and “In 1940” repeatedly begin sentences, while “The years starts from 1920 to 2019” repeats information already given. The opening also spends several sentences describing chart labels instead of establishing the main message. Grouping the appliance trends together—for example, noting that refrigerators and vacuum cleaners reached 100% while washing machines rose more gradually—and using a concise overview would create clearer progression and stronger cohesion.
Lexical Resource: Band 5.0
You use relevant topic vocabulary, including “percentage,” “household,” “refrigerator,” and “vacuum cleaner,” so the subject is generally clear. However, the range is limited and several expressions are repetitive or imprecise. “Were used” is repeated for ownership data, although the chart measures the proportion of households that owned appliances; “ownership” or “households had” would be more accurate. “The number of year” and “same ratio” are also awkward choices, and “household work” is less suitable than “housework.” These choices sometimes make the description less precise, even when the intended meaning can be inferred. Build a small set of accurate trend verbs and comparison phrases, such as “rose,” “levelled off,” and “reached full ownership,” and use them instead of repeating “was used.”
Grammatical Range and Accuracy: Band 5.0
Most sentences use simple past forms to describe the historical data, and the reader can usually understand the intended comparisons. However, grammatical errors occur frequently, particularly in subject–verb agreement, articles, and plural forms. Examples include “The household work includes,” “The percentage of household starts,” and “The years starts”; these subjects require different verb forms, and “household” needs appropriate plural or possessive wording. There are also errors in constructions such as “the percentage of refrigerator used were 0” and “the number of hours were decreasing.” Sentence patterns are mostly simple, with little variety beyond repeated “In [year]” statements. Practise accurate subject–verb agreement and plural forms, then combine related figures using controlled clauses such as “while” or “whereas.”
See this exact question answered at other band scores. The same prompt compared across bands.
Browse more IELTS Writing model answers or get your own writing scored by the same AI examiner.