Band 5.5 IELTS Writing Task 1 Model Answer
Overall Band Score: 5.5 · Cambridge IELTS 16 · 2026-11-11
IELTS Writing Task 1 question
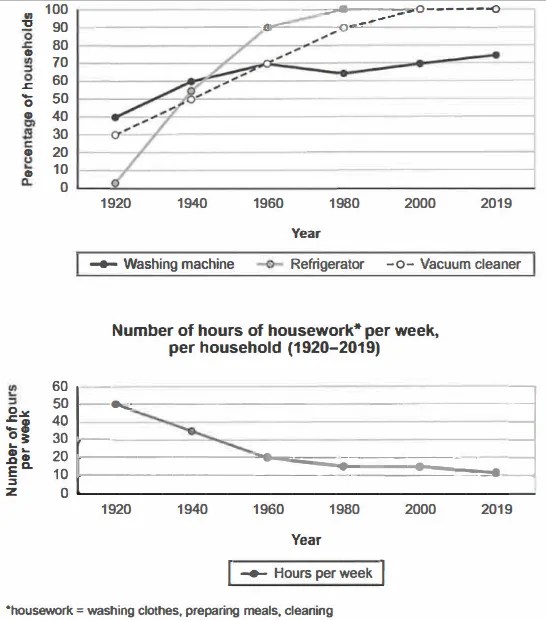
The charts below show the changes in ownership of electrical appliances and amount of time spent doing housework in households in one country between 1920 and 2019.
Summarise the information by selecting and reporting the main features, and make comparisons where relevant.
Percentage of households with electrical appliances (1920-2019)
Student answer (Band 5.5)
This line graphs present the difference between ownership of electrical appliances and amount of time spent during housework in households in a country over a period of 99 years.
As the firs graph shows that the percentage of household reaches from 0 % to 100 %.The second graph display number of hours per weak. The first graph shows the percentage of households including washing machine, refrigerator, and vacuum cleaner. The washing machine shows moderate increase from 40 to 75. Moreover the refrigerator shows dramatically increase from 0 to 100 between these years. Vacuum cleaner also provide a good percentage rate from 30 to 100. As a whole washing machine provide a good percentage rate between the time period of 99 years.
Likewise the second graph shows number of hours per weak like we can see a decrease for every household from 50 hours to 10 hours between a duration of 99 years.
AI examiner evaluation
| Criterion | Band |
|---|---|
| Task Achievement / Task Response | 5.0 |
| Coherence and Cohesion | 5.5 |
| Lexical Resource | 5.5 |
| Grammatical Range and Accuracy | 5.0 |
| Overall | 5.5 |
Task Achievement / Task Response: Band 5.0
You identify both charts and report the broad patterns: appliance ownership generally rises, while weekly housework falls. However, the response only partially covers the task because it gives few comparisons across the years and omits important stages, such as refrigerators reaching 100% by 1980 and vacuum cleaners reaching full ownership by 2000. The refrigerator starts at about 2%, not 0%, and housework ends at about 11 hours, rather than 10. The washing-machine trend also includes a dip around 1980, which is not mentioned. The overview is vague, and the response is 143 words, below the required 150; the nine words copied from the prompt do not count. Add a clearer overview and several accurate, selected comparisons.
Coherence and Cohesion: Band 5.5
The response has a basic sequence: it introduces the charts, discusses appliance ownership, and then turns to housework. This makes the main subject understandable. However, the progression within the appliance paragraph is limited, and the repeated phrasing—“The first graph shows” and “the second graph shows”—makes the organisation feel mechanical. “As the firs graph shows that” also creates an unclear opening to the detail, while “As a whole” introduces a point that repeats the washing-machine trend rather than summarising the charts. Use separate paragraphs for the overview and key details, and group comparisons by trend or time period. More precise links between the two charts would make the report easier to follow.
Lexical Resource: Band 5.5
You use relevant task vocabulary, including “percentage,” “ownership,” “increase,” “decrease,” and “households,” so the reader can identify the main subject. However, the range is limited and several word choices or collocations are unnatural: “dramatically increase,” “provide a good percentage rate,” and “during housework.” “Between these years” is also vague when describing a trend across the period. Spelling errors such as “firs” and “weak” reduce accuracy and can distract the reader. Aim for precise chart language, for example, “rose sharply,” “accounted for,” or “hours spent on housework.” Avoid evaluative phrases such as “good percentage rate,” which do not describe the data objectively.
Grammatical Range and Accuracy: Band 5.0
The response communicates its general meaning, but grammatical control is uneven and the sentence patterns are mostly simple. There are recurring errors in agreement and sentence construction: “This line graphs present” should use a singular subject and matching verb, while “As the firs graph shows that” incorrectly combines an introductory clause with “that.” Other examples include “the percentage of household reaches” and “the second graph display,” where subject–verb agreement is missing. Articles and plural forms are also inconsistent, as in “the percentage of household.” Try building accurate sentences with a clear subject and verb, and use a wider range of controlled comparisons, such as “Refrigerator ownership rose from about 2% to 100% by 1980.” Check punctuation and spacing around percentages as well.
See this exact question answered at other band scores. The same prompt compared across bands.
Browse more IELTS Writing model answers or get your own writing scored by the same AI examiner.