Band 5.5 IELTS Writing Task 1 Model Answer
Overall Band Score: 5.5 · Cambridge IELTS 16 · 2026-11-12
IELTS Writing Task 1 question
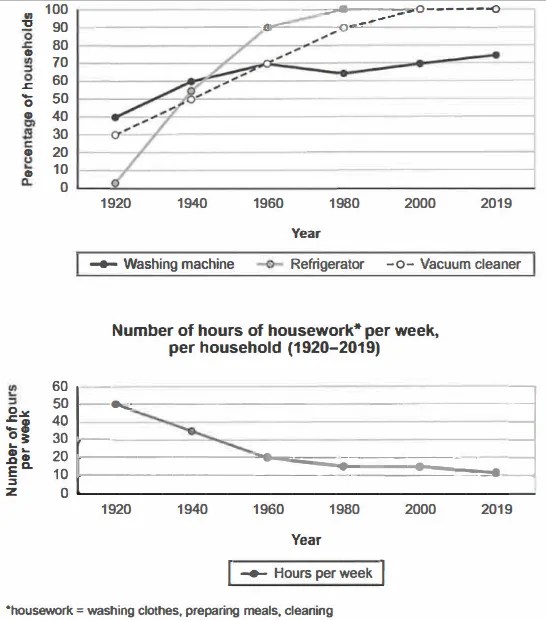
The charts below show the changes in ownership of electrical appliances and amount of time spent doing housework in households in one country between 1920 and 2019.
Summarise the information by selecting and reporting the main features, and make comparisons where relevant.
Percentage of households with electrical appliances (1920-2019)
Student answer (Band 5.5)
The line chart represents the changes of differents electronics things and ownwership and the time used on these things in a house in one country between 1920 and 2019.Overall, it tell the percentages of washing machine,refrigerator and vacuum cleaner.
On the first chart we can see in 1920 the refrigerator is on 0% but after some years passess the percentage will be increase and reach to 55% in 1940 laterly it's rose up again and in1960 it is on 90% after that the percentage of refrigerator increased again and reach 100% in 1980 and from that time to 2019 it is on 100%.Next,vacuum cleaner in 1920 is on 30% and the percentage of vacuum cleaner increased years and years and in 2000 it's reach on 100% and from that time till 2019 it is on 100%.Lastly, the washing machine in 1920 is on 40% and after that it's rose up till 1960 and reach 70% and after that it's go slightly down and in 1980 it is on 65% after that it's raised up again and reach 75% in 2019.On the other hand, the number of hours of house work per week is decreased day by day in 1920 it is on 50 hours per week but after some years it's decrease to 10 hours in 2019.
AI examiner evaluation
| Criterion | Band |
|---|---|
| Task Achievement / Task Response | 6.0 |
| Coherence and Cohesion | 6.0 |
| Lexical Resource | 5.0 |
| Grammatical Range and Accuracy | 5.0 |
| Overall | 5.5 |
Task Achievement / Task Response: Band 6.0
You cover both charts and identify the main broad patterns: appliance ownership generally rose, while weekly housework time fell. You also include useful figures for the refrigerator and vacuum cleaner reaching 100%, and describe the washing-machine dip before its later rise. However, the overview is incomplete: it says only that the first chart shows appliance percentages, rather than summarising the key contrasts across both charts. Some details are inaccurate or unclear: the refrigerator was about 2%, not 0%, in 1920, and its ownership reached about 90% in 1960, not 55%. Housework fell to about 11 hours in 2019, rather than 10. A clearer overview and more careful reporting of the figures would strengthen the response.
Coherence and Cohesion: Band 6.0
The response follows a generally understandable order, moving through the three appliances and then the housework figures. Sequencing expressions such as “Next,” “Lastly,” and “after that” help the reader follow the timeline. However, the information is presented as one long paragraph, and repeated use of “after that” makes the progression mechanical. The opening overview does not clearly preview the main trends, so the reader has to infer the overall comparison from the detailed account. Separate the introduction, overview, and detail into paragraphs, and group the appliance trends before contrasting them with the sharp decline in housework time. This would make the organisation clearer and cohesion less repetitive.
Lexical Resource: Band 5.0
You use relevant basic terms, including “percentage,” “increased,” “decreased,” and “reach,” so the chart’s general meaning is usually clear. However, vocabulary is limited and several choices or forms are inaccurate, such as “differents electronics things,” “ownwership,” “passess,” and “house work.” Phrases such as “increased years and years” and “it’s on 100%” are also unnatural for describing data. Use precise chart language, for example, “the proportion of households owning a refrigerator rose” or “housework hours declined.” Check spelling and choose standard collocations; this will make the description more concise and easier to understand.
Grammatical Range and Accuracy: Band 5.0
You attempt some longer sentences to describe changes over time, and the basic meaning is generally recoverable. However, many sentences rely on the same simple pattern and contain errors in verb forms, agreement, articles, and punctuation. For example, “Overall, it tell” should be “Overall, it shows,” while “the percentage … will be increase” needs a past-tense form such as “increased.” In “the washing machine … it’s rose up,” the verb form is incorrect; use “it rose.” Several sentences run together without full stops, and spaces after commas are often missing. Practise accurate past-tense reporting and divide long sequences into shorter, correctly punctuated sentences.
See this exact question answered at other band scores. The same prompt compared across bands.
Browse more IELTS Writing model answers or get your own writing scored by the same AI examiner.