Band 5.5 IELTS Writing Task 1 Model Answer
Overall Band Score: 5.5 · Cambridge IELTS 16 · 2026-11-13
IELTS Writing Task 1 question
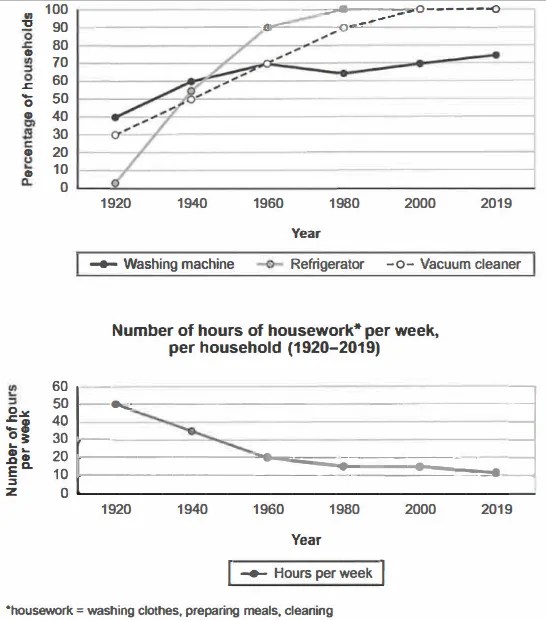
The charts below show the changes in ownership of electrical appliances and amount of time spent doing housework in households in one country between 1920 and 2019.
Summarise the information by selecting and reporting the main features, and make comparisons where relevant.
Percentage of households with electrical appliances (1920-2019)
Student answer (Band 5.5)
The line charts illustrate the differences in ownership of electrical devices and the number of hours spent doing housework in household one particular country from 1920 to 2019.
Overall, refrigerator showed a sharp increase of household device rather than other devices, whilst washing machine represented fluctuation and vacuum cleaner experienced steady rise, over the 100 years of period.
In 1920, the percentage of refrigerator number was 0%. In contrast, washing machine accounted for 40% and vacuum cleaner 30% . But in 1940, washing machine rose sharply and the number stand at around 55%. And washing machine and vacuum cleaner consisted 10% growth respectively. However, in 1960 , washing machine and vacuum reached at same percentage in 70%. And refrigerator increased 35%.
In 1980, refrigerator accounted for 100% and remain same percentage next 40 years of period till 2019. The percentage of Vacuum cleaner experienced 20% growth and in the last 20 year represented 100%. In contrast, there was a slight decline on washing machine around 6% in 1980. After that the percentage started to increase and stand at 75% in 2019.
AI examiner evaluation
| Criterion | Band |
|---|---|
| Task Achievement / Task Response | 4.0 |
| Coherence and Cohesion | 5.5 |
| Lexical Resource | 6.0 |
| Grammatical Range and Accuracy | 5.5 |
| Overall | 5.5 |
Task Achievement / Task Response: Band 4.0
You identify the broad pattern that appliance ownership generally rose, and you report several relevant figures, including washing machines at 40% in 1920 and refrigerators reaching 100% by 1980. However, the response does not adequately summarise both charts: it gives no account of the housework-hours trend, a major feature of the task. Some appliance data are also misreported or unclear: refrigerators were about 2%, not 0%, in 1920; washing-machine ownership was about 60%, not 55%, in 1940; and the refrigerator increase from 1940 to 1960 was about 35 percentage points, not simply “increased 35%.” The overview also misses the key contrast between near-universal refrigerator and vacuum-cleaner ownership and the continuing lower, fluctuating washing-machine figure. Cover both charts and select the main comparisons more accurately.
Coherence and Cohesion: Band 5.5
The response has a recognisable structure: an introduction, an overview, and a chronological account of appliance ownership. Time markers such as “In 1920,” “in 1940,” and “In 1980” help readers follow the sequence, while “In contrast” signals comparison. However, the progression is incomplete because the second chart is never discussed, and the overview does not prepare the reader for a balanced account of both visuals. Some links are also unclear: “And washing machine and vacuum cleaner consisted 10% growth respectively” does not clearly explain which figures are being compared. Grouping the appliance trends together and adding a separate paragraph on housework hours would make the organisation more complete and the comparisons easier to follow.
Lexical Resource: Band 6.0
You use a reasonable range of trend vocabulary for describing a graph, including “sharp increase,” “fluctuation,” “steady rise,” “slight decline,” and “accounted for.” These choices show an attempt to vary your language rather than repeat “increase” throughout. Some expressions, however, are imprecise or do not collocate naturally, such as “refrigerator number,” “sharp increase of household device,” and “consisted 10% growth.” This sometimes makes the intended comparison difficult to understand. Use standard graph language and name the measure clearly—for example, “the proportion of households owning refrigerators” or “ownership rose by 10 percentage points.” More precise wording would help you report the data accurately and make your comparisons sound more natural.
Grammatical Range and Accuracy: Band 5.5
You attempt a mix of simple and more complex sentences, including a contrast clause beginning “whilst” and sentences using “However” and “In contrast.” The main trends are often understandable, but some grammatical errors remain. For example, “the number stand” needs past-tense agreement (“the figure stood”), and “refrigerator showed” would be clearer with an article or plural subject. There are also problems with sentence construction in “washing machine and vacuum cleaner consisted 10% growth respectively,” and punctuation spacing is inconsistent, as in “30% .” Keep the chart description consistently in the past tense, check subject–verb agreement, and build comparisons with complete clauses. These revisions would improve accuracy while preserving your range of sentence forms.
See this exact question answered at other band scores. The same prompt compared across bands.
Browse more IELTS Writing model answers or get your own writing scored by the same AI examiner.