Band 5.0 IELTS Writing Task 1 Model Answer
Overall Band Score: 5.0 · Cambridge IELTS 16 · 2026-11-14
IELTS Writing Task 1 question
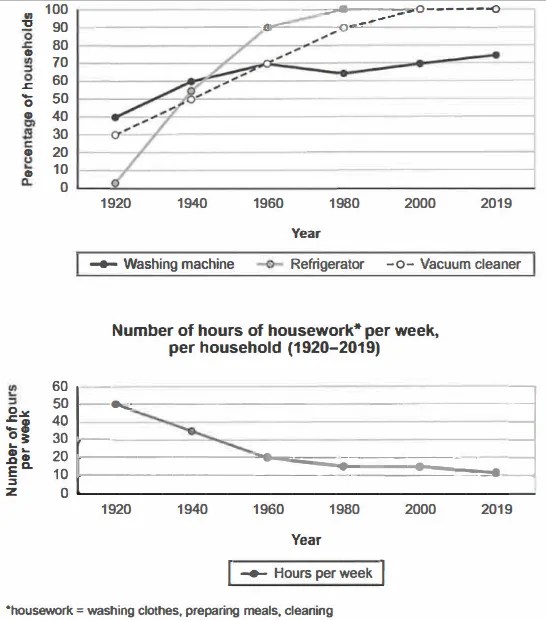
The charts below show the changes in ownership of electrical appliances and amount of time spent doing housework in households in one country between 1920 and 2019.
Summarise the information by selecting and reporting the main features, and make comparisons where relevant.
Percentage of households with electrical appliances (1920-2019)
Student answer (Band 5.0)
The line graph illustrates the changes in ownership of three different electrical devices and total amount of time spent doing housework in households in one country in 1920 and 2019.
Overall,refrigerator usage surged more throghout significant period of time whereas,washing machine usage slightly went down in mid year and then again increased. However, usage of vacuum cleaner surged and plateaued by end.
In 1920, The percentage of refrigerator was 0% and it soared 100% in 2000,whereas washing machine usage start at 40% went up to 70% in 1960 then plummeted at 60% in 1980 and by end of throughout period stood at approximately 75%. Vaccum cleaner usage in 1920 stood at 30% then remain steady till 1980 then plateaued by 2000.
AI examiner evaluation
| Criterion | Band |
|---|---|
| Task Achievement / Task Response | 3.5 |
| Coherence and Cohesion | 5.5 |
| Lexical Resource | 6.0 |
| Grammatical Range and Accuracy | 5.5 |
| Overall | 5.0 |
Task Achievement / Task Response: Band 3.5
The response identifies the broad topic and gives a brief overview of appliance ownership, but it does not adequately summarise the full visual. It omits the housework-hours series entirely and gives little usable information about the vacuum cleaner: the chart shows it rising from about 30% in 1920 to 90% in 1980 and 100% by 2000, not remaining steady until 1980. Other figures are also inaccurate: refrigerators were about 2% in 1920 and reached 100% by 1980, rather than 0% and 100% in 2000; washing-machine ownership was about 65% in 1980, not 60%. The response is 110 words, below the 150-word minimum. Include both charts’ main trends and key comparisons, supported by accurate figures.
Coherence and Cohesion: Band 5.5
The response has a recognisable structure: an introduction, an overview, and a paragraph with selected figures. This gives the reader some sense of organisation, and contrast markers such as “whereas” help connect comparisons. However, the progression is incomplete because the housework data is not discussed, and the final paragraph moves between appliances without covering each trend clearly. Some linking is awkward or unclear, particularly “and by end of throughout period.” The overview also repeats the idea of rising ownership without setting out the main contrast with declining housework time. Organise the details into clear comparisons, use a consistent time sequence, and ensure each paragraph develops one part of the chart.
Lexical Resource: Band 6.0
There is an adequate range of trend vocabulary, including “surged,” “plummeted,” “plateaued,” and “stood at,” which shows an attempt to describe changes rather than simply list figures. Some choices, however, are inaccurate or unnatural in context: “refrigerator usage” is less precise than household ownership, and “usage of vacuum cleaner surged” does not clearly describe the chart’s gradual rise. Spelling errors such as “throghout” and “Vaccum” also reduce accuracy. The phrase “significant period of time” is vague and adds little information. Aim for precise chart language and check spelling; use terms such as “the proportion of households owning” and “rose steadily” where they match the data.
Grammatical Range and Accuracy: Band 5.5
The response attempts both simple and more complex sentences, including comparisons joined with “whereas” and a sequence of changes in the washing-machine figure. Meaning is generally understandable, but some grammatical and punctuation errors remain. For example, “washing machine usage start at 40% went up” has an incorrect verb form and lacks a clear grammatical link between the clauses; “then remain steady” also needs past-tense agreement. Capitalisation is inconsistent in “In 1920, The percentage,” and there are missing spaces after commas, as in “2000,whereas.” The overview’s punctuation around “Overall” is also faulty. Use past tense consistently for the historical data and separate clauses with accurate punctuation.
See this exact question answered at other band scores. The same prompt compared across bands.
Browse more IELTS Writing model answers or get your own writing scored by the same AI examiner.