Band 5.0 IELTS Writing Task 1 Model Answer
Overall Band Score: 5.0 · Cambridge IELTS 16 · 2026-11-15
IELTS Writing Task 1 question
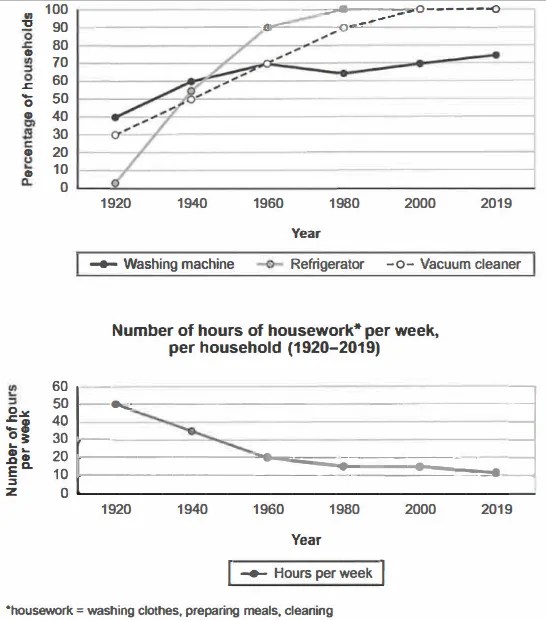
The charts below show the changes in ownership of electrical appliances and amount of time spent doing housework in households in one country between 1920 and 2019.
Summarise the information by selecting and reporting the main features, and make comparisons where relevant.
Percentage of households with electrical appliances (1920-2019)
Student answer (Band 5.0)
The line graph illisturate the change in the ownership of electrical appliances and the numbers of the hours in the homework by the households in that states between 1920 and 2019.
overall,the first line graph illisturate the percentage of the households they are using between the 1920 to 2019.the second line graph shows the number of hours of the household as per weeks
In first graph the refrigerator are the most used households up to 100% from 1980 to 2019.the second the vacuum cleaners are the second most products which are use up to 100% from 2000 to 2019.As the washing machine are on the third place.
In second graph the number of the hours of the houseworkd per week per household decreses from 50% to 10% the 1920 to 2019. about the numberes of the hours os the houseworks pre week pre household remain constant from 1980 to 2019.
AI examiner evaluation
| Criterion | Band |
|---|---|
| Task Achievement / Task Response | 5.0 |
| Coherence and Cohesion | 5.5 |
| Lexical Resource | 5.0 |
| Grammatical Range and Accuracy | 5.0 |
| Overall | 5.0 |
Task Achievement / Task Response: Band 5.0
You identify both charts and report several relevant overall features, including the refrigerator reaching full ownership and housework time declining. However, the response only partially summarises the data: it gives few accurate figures for the appliance trends and does not clearly compare their changes over time. The claim that refrigerators were the most used appliance from 1980 to 2019 overlooks that vacuum cleaners also reached 100% by 2000, while washing-machine ownership rose overall but dipped in 1980. Housework fell from about 50 to 11 hours, not from 50% to 10%, and the period of stability was roughly 1980–2000, not through 2019. A clearer overview and more precise comparisons would strengthen the report.
Coherence and Cohesion: Band 5.5
The response has some organisation: it moves from an opening description to the appliance chart and then the housework chart, and phrases such as “In first graph” and “In second graph” help signal the topic. However, the progression within the appliance paragraph is difficult to follow, particularly “the second the vacuum cleaners are the second most products,” and the overview repeats what each graph shows rather than bringing their main trends together. Linking words and references are limited, and the final sentence repeats the housework information without clearly connecting it to the earlier decline. Use separate, purposeful paragraphs and sequence comparisons by year or trend, with clear links such as “By contrast” and “Meanwhile.”
Lexical Resource: Band 5.0
You use some task-relevant vocabulary, including “ownership,” “percentage,” “remain constant,” and “per week,” so the reader can recognise the subject of the charts. However, the range is limited and several word choices or forms make the meaning awkward: “numbers of the hours in the homework,” “most used households,” and “second most products” are not natural descriptions of the data. Spelling errors such as “illisturate,” “decreses,” and “houseworkd” are also noticeable. Choose precise chart language and collocations, for example, “the proportion of households owning an appliance” and “hours spent on housework.” Check spelling and avoid repeating “the number of hours” when a concise alternative is available.
Grammatical Range and Accuracy: Band 5.0
The response attempts several sentence forms, including comparisons and a time clause, but the range is limited and errors occur frequently enough to make some sentences difficult to interpret. For example, “the refrigerator are the most used households” has problems with subject–verb agreement and sentence structure, while “the number of the hours … decreses from 50% to 10% the 1920 to 2019” has an unclear construction and missing prepositions. Articles, plurals, and verb forms are also inconsistent, as in “the washing machine are.” Aim first for accurate simple sentences with a clear subject and verb, then add controlled clauses. Use past-tense reporting consistently and check agreement, articles, and prepositions.
See this exact question answered at other band scores. The same prompt compared across bands.
Browse more IELTS Writing model answers or get your own writing scored by the same AI examiner.