Band 5.5 IELTS Writing Task 1 Model Answer
Overall Band Score: 5.5 · Cambridge IELTS 16 · 2026-11-15
IELTS Writing Task 1 question
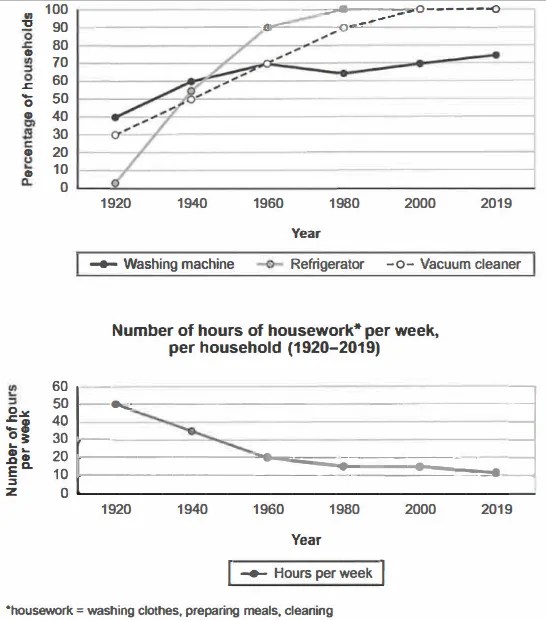
The charts below show the changes in ownership of electrical appliances and amount of time spent doing housework in households in one country between 1920 and 2019.
Summarise the information by selecting and reporting the main features, and make comparisons where relevant.
Percentage of households with electrical appliances (1920-2019)
Student answer (Band 5.5)
The graph illustrates percentage of households electrical appliances from 1920 to 2019.
Overview of electrical appliances are different.Vacuum cleaner show a sharp vertical move in 1940. While Washing machine was overall moderat.But in 1980 it slightly decline .Refrigerator results were over all high but from 1980 to 2019 it become similar it was than significant .
Overview of secound graph demonostrat housework such as washing clothes, preparing meals in hours per week. In1940 and a dramatic decline toward down is shown.
On one hand the utlization of electronics was low in 1920 .Washing machine was utlized by 40% houses .Slightly increase occur in 1940 .In 2019 it rose and reach to its peak. Vaccum cleaner percentage slightly move upward in 1980 it was approximately 90%. Refrigerator utilizers were 0%in 1920 a sharp vertical move is demonostrat in 1940.in 2000 ,2019 it rose to peak 100% as in contrast with Vaccum cleaner.
On other hand hours of housework was 50% in 1920 which was highest .A decline slightly is shown in 1940 .In 2019 it reach to approximately 10%.
In conclusion, all the electronics utlizers increaesd in 2019 while the housework per week slightly decline and reach to 10%.
AI examiner evaluation
| Criterion | Band |
|---|---|
| Task Achievement / Task Response | 6.0 |
| Coherence and Cohesion | 5.5 |
| Lexical Resource | 5.0 |
| Grammatical Range and Accuracy | 5.0 |
| Overall | 5.5 |
Task Achievement / Task Response: Band 6.0
You cover both charts and identify the main broad patterns: appliance ownership generally rose, while weekly housework fell from 50 hours to about 10–11. You also include several relevant figures, such as washing machines at 40% initially and vacuum cleaners at about 90% in 1980. However, some important details are unclear or inaccurate: the vacuum cleaner’s sharp rise is associated with 1940, but its increase continues across later years; refrigerator ownership reaches 100% by 1980, not only in 2000 and 2019; and the washing-machine trend is not simply a steady rise, as it dips in 1980. The overview mentions these trends but does not clearly compare the appliances or highlight the housework’s overall decline. Develop the overview and report the key stages more precisely.
Coherence and Cohesion: Band 5.5
The response has a recognisable structure: an opening, overview statements, details about appliance ownership, and a final comparison with housework. This helps the reader identify the two charts being discussed. However, progression is uneven because the overview is split across several unclear statements, and details are not consistently grouped or ordered. For example, “On one hand” and “On other hand” do not create a clear comparison between the appliance series and housework, while “In conclusion” repeats the general trends rather than adding a useful synthesis. Some linking words and references are also difficult to follow. Organise the response into a concise introduction, a clear overview, and two data-focused paragraphs, using transitions only where they clarify relationships.
Lexical Resource: Band 5.0
You attempt a range of task-related vocabulary, including “percentage,” “decline,” “utilization,” and “peak,” and the reader can generally recognise the intended trends. However, word choice and collocation are often inaccurate or repetitive, which sometimes makes the meaning difficult to interpret. Phrases such as “sharp vertical move,” “results were over all high,” and “it become similar it was than significant” are not natural ways to describe the data. There are also noticeable spelling and word-form errors, including “demonostrat,” “Vaccum,” “secound,” and “increaesd.” Use standard chart language such as “rose sharply,” “remained high,” and “reached a plateau,” and check spelling and word forms carefully.
Grammatical Range and Accuracy: Band 5.0
You attempt both short statements and longer sentences, and some basic relationships between trends are understandable. However, the range of sentence structures is limited, and errors in sentence formation, verb forms, articles, and punctuation frequently make the account hard to read. Examples include “Overview of electrical appliances are different,” “Washing machine was overall moderat,” and “In 2019 it reach to approximately 10%.” Several sentences are fragments or have unclear clause connections, such as “While Washing machine was overall moderat.” Aim for complete sentences with a clear subject and verb, and use past-tense forms consistently when describing the historical data. For example: “Housework fell from 50 hours per week in 1920 to about 11 hours in 2019.”
See this exact question answered at other band scores. The same prompt compared across bands.
Browse more IELTS Writing model answers or get your own writing scored by the same AI examiner.