Band 5.5 IELTS Writing Task 1 Model Answer
Overall Band Score: 5.5 · Cambridge IELTS 16 · 2026-11-16
IELTS Writing Task 1 question
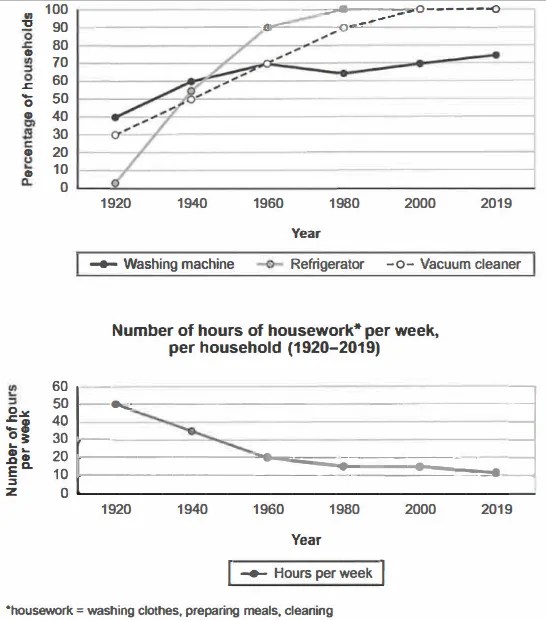
The charts below show the changes in ownership of electrical appliances and amount of time spent doing housework in households in one country between 1920 and 2019.
Summarise the information by selecting and reporting the main features, and make comparisons where relevant.
Percentage of households with electrical appliances (1920-2019)
Student answer (Band 5.5)
THE PROVIDED LINE GRAPHS ILLUSTRATE THE CHANGES IN POSSESSION OF ELECTRICAL APPLIANCES AND THE TOTAL TIME SPENT IN WORK DOING IN A COUNTRY FROM 1920 TO 2019.
OVERALL, THE GRAPH REPRESENT THE PERCENTAGE OF HOUSEHOLD WORK WITH THE NUMBER OF HOURS PER WEEK BETWEEN THESE TIME LINE.
IN 1920, PERCENTAGE OF HOUSEHOLDS WITH REFRIGERATOR WAS ZERO BUT AFTER A SHARP INCREASED IN IT, IT WAS UPTO MORE THAN 50%AND ALSO ROSE IN FURTHER YEARS AND IN 1980, IT MADE A PEAK AND THEN TRAVEL WITH THE SAME PEAK IN FURTHER YEARS AND WAS HUNDRED PERCENT WHILE IN 1920, THE PERCENTAGE OF HOUSEHOLDS WITH WASHING MACHINE WAS 40 PERCENT AND INCREASED GRADUALLY ,IN 1960 IT WAS ABOUT 70% BUT AFTER 1960, IT WAS DECLINED SLOWLY BUT AFTER 1980 IT WAS ALSO GRADUAL ROSE IN IT AND WAS MORE THAN SEVENTY PERCENT IN 2019.IN 1920, THE PERCENTAGE OF VACCUM CLEANER WAS ABOUT 30 PERCENT AND AFTER A STEADY INCREASED IN THIS IT WAS ABOUT 100% IN 2000 AND ALSO MADE A PEAK AND TRAVEL WITH THE SAME CONSTANT LEVEL IN 2019.
FOLLOWED THIS, IN 1920 THE NUMBER OF HOURS PER WEEK WAS 50% BUT AFTER A STEADY DECLINED IT WAS REMAINED 20 PERCENT IN 1960 AFTER THAT, IT WAS ALSO SLOWLY DECREASED IN IT AND MADE A CONSTANT LEVEL BETWEEN 1980 AND 2000 BUT IT ALSO DECLINED AFTER 2000 AND REMAINED ABOUT ONLY TEN PERCENT.
AI examiner evaluation
| Criterion | Band |
|---|---|
| Task Achievement / Task Response | 5.5 |
| Coherence and Cohesion | 5.5 |
| Lexical Resource | 5.0 |
| Grammatical Range and Accuracy | 5.0 |
| Overall | 5.5 |
Task Achievement / Task Response: Band 5.5
You cover both charts and identify the main broad patterns: appliance ownership generally rose, while weekly housework time fell. Several figures and trends are also reported accurately, including washing machines at about 40% in 1920 and 70% in 1960, and vacuum cleaners reaching 100% by 2000. However, some details are inaccurate or unclear: refrigerators were about 2%, not zero, in 1920, and they reached 100% by 1980 rather than simply making a peak. The housework figures are hours, not percentages; for example, the value was 20 hours in 1960 and about 11 in 2019. The overview is also vague and does not clearly summarise the contrast between near-universal appliance ownership and reduced housework time. A more precise overview and careful units would strengthen coverage.
Coherence and Cohesion: Band 5.5
The response includes an opening, an overview, and separate discussion of appliance ownership and housework, so the reader can recognise the intended organisation. However, progression within the main paragraph is difficult to follow because several long sequences are joined with repeated “and,” “but,” and “after.” For instance, the refrigerator and washing-machine trends are combined in one extended sentence, making comparisons hard to track. “Followed this” does not clearly signal the shift to the second chart, and references such as “it” and “this” are sometimes ambiguous. Use distinct paragraphs for the appliance trends and housework, and organise each around clear comparisons across years. A smaller set of accurate linking phrases would make the progression more coherent and less mechanical.
Lexical Resource: Band 5.0
You use some relevant chart vocabulary, including “percentage,” “steady increase,” “declined,” and “constant level,” which helps communicate the general trends. However, the range is limited and several word choices or collocations are inaccurate or unnatural, sometimes making the meaning difficult to interpret. Examples include “possession” for household ownership, “the graph represent the percentage of household work,” and “travel with the same peak.” There are also spelling errors in “vaccum” and “upto,” while “made a peak” is not a natural description of a line reaching a maximum. Build a more precise set of trend expressions, such as “rose to,” “levelled off,” and “remained stable,” and use the chart’s terms consistently, especially “hours of housework” rather than “percentage” for the second measure.
Grammatical Range and Accuracy: Band 5.0
You attempt complex sentences to describe changes over time, but these are often difficult to control, and errors occur frequently enough to affect clarity. For example, “the graph represent” has subject–verb disagreement, while “the number of hours per week was 50%” uses an incorrect grammatical construction for the measure. Long sentences joined by repeated conjunctions also create unclear relationships between clauses, as in the passage describing refrigerators and washing machines. Articles and sentence boundaries are often missing or inconsistent, and capitalising the entire response makes punctuation harder to read. Practise writing shorter, complete sentences with a clear subject and verb, then add controlled clauses using “while” or “whereas.” Check agreement, articles, and punctuation when editing.
See this exact question answered at other band scores. The same prompt compared across bands.
Browse more IELTS Writing model answers or get your own writing scored by the same AI examiner.