Band 6.0 IELTS Writing Task 1 Model Answer
Overall Band Score: 6.0 · Cambridge IELTS 16 · 2026-11-16
IELTS Writing Task 1 question
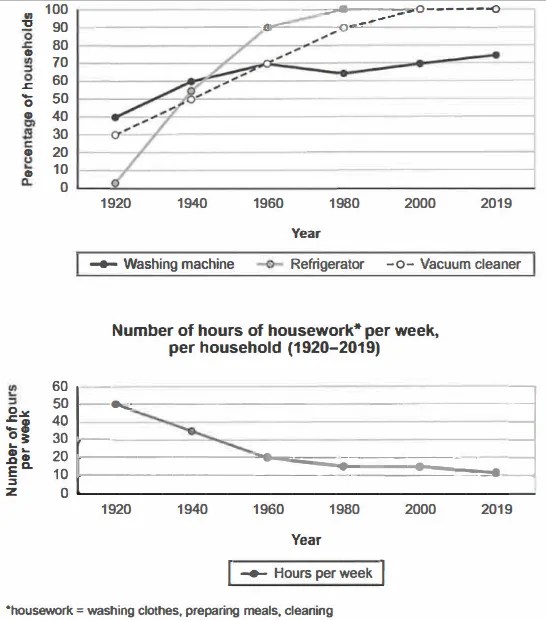
The charts below show the changes in ownership of electrical appliances and amount of time spent doing housework in households in one country between 1920 and 2019.
Summarise the information by selecting and reporting the main features, and make comparisons where relevant.
Percentage of households with electrical appliances (1920-2019)
Student answer (Band 6.0)
The given line graphs illustrates the changes in ownership of electrical appliances and amount of time spent doing housework in households in one country between 1920 and 2019. Overall, the general trend of the first line graph is upward in all categories, while second line graph figure decreased steadily over the period.
At first glance, it is evident that first line graph represent three electrical appliances used with households from 1920 to 2019, and the washing machine is the most common electrical appliances used in households with 40% in the starting of the 1920 it increased by 30% in 1960 than it dropped slightly in 1980, and begin to surge once again untill 2019 by approximately 68%.while refrigerator begins with 0% in the beginning but it reached its peak in 1980 by 100% and remained constant untill 2019.Moreover, the vacuum cleaner also begin to surge from the starting until 2000 and remained stable till 2019.
On the other hand, it is lucid that other line graph depicts the housework hours per week by per household over the same period. Moreover, the figure started to decrease frequently in the beginning of the 1920 which is 50% until 1960 by 30%, and then it dropped slightly until 2019 by 10%.
AI examiner evaluation
| Criterion | Band |
|---|---|
| Task Achievement / Task Response | 6.0 |
| Coherence and Cohesion | 6.5 |
| Lexical Resource | 6.0 |
| Grammatical Range and Accuracy | 5.0 |
| Overall | 6.0 |
Task Achievement / Task Response: Band 6.0
You identify the broad patterns accurately: appliance ownership generally rises, while housework time falls. The response also includes relevant figures, such as washing machines at 40% initially and refrigerators reaching 100% by 1980. However, some details are inaccurate or unclear: refrigerators begin at about 2%, not 0%, and housework falls from 50 hours to 20 by 1960, rather than decreasing by 30% (these are hours, not percentages). The overview could compare the series more precisely, noting that refrigerators and vacuum cleaners reach full household coverage, while washing machines remain below that level. The vacuum-cleaner trend is mentioned but not supported with figures, so some key information is less fully developed than other parts.
Coherence and Cohesion: Band 6.5
The response has a clear overall arrangement: an introduction and overview are followed by appliance details and then housework data. This gives the reader a recognisable progression, and phrases such as “Overall” and “On the other hand” help signal the structure. Some links are less effective or repetitive, however. “Moreover” is used to introduce information that is not an additional point, and the long appliance sentence combines several years and trends without clear separation. The reference to the “first line graph” and “second line graph” is understandable, but more direct grouping by appliance and by housework would make the comparisons easier to follow. Use shorter, clearly punctuated sentences and connect each figure to the trend it illustrates.
Lexical Resource: Band 6.0
You use a reasonable range of task-related vocabulary, including “ownership,” “remained constant,” “decreased,” and “depicts,” and the main meaning is generally clear. There are also attempts at more formal description, such as “it is evident” and “it is lucid,” though the latter sounds unnatural in this context. Some word choices and collocations are imprecise: “used with households” and “in the starting of the 1920” do not express the intended meaning naturally. “Surge” suggests a sharp rise, which is not a good fit for every gradual change described. Spelling errors such as “untill” and “begin” where “began” is needed also reduce accuracy. Aim for precise trend language and check spelling and word forms.
Grammatical Range and Accuracy: Band 5.0
You attempt both simple and complex sentences, including a useful overview with a contrast between the two graphs. However, errors in agreement, articles, verb forms, and sentence boundaries are frequent enough to make some sentences awkward. For example, “The given line graphs illustrates” has a plural subject with a singular verb, while “the first line graph represent” has the same agreement problem. In “the washing machine … it increased … than it dropped,” the sequence of clauses is not grammatically controlled, and the long sentence needs clearer punctuation. Other examples include “the figure started to decrease … which is 50%” and “by per household.” Practise accurate subject–verb agreement and past-tense reporting, and divide multi-stage descriptions into complete sentences.
See this exact question answered at other band scores. The same prompt compared across bands.
Browse more IELTS Writing model answers or get your own writing scored by the same AI examiner.