Band 5.5 IELTS Writing Task 1 Model Answer
Overall Band Score: 5.5 · Cambridge IELTS 16 · 2026-11-16
IELTS Writing Task 1 question
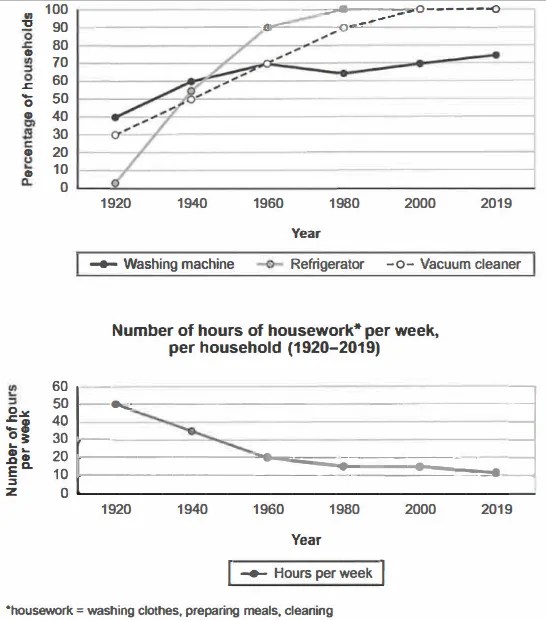
The charts below show the changes in ownership of electrical appliances and amount of time spent doing housework in households in one country between 1920 and 2019.
Summarise the information by selecting and reporting the main features, and make comparisons where relevant.
Percentage of households with electrical appliances (1920-2019)
Student answer (Band 5.5)
The line charts illustrate the changes in ownership of electrical appliances and amount of time spent doing housework in households in one country between 1920 and 2019.
Overall, it is clear that the most dominant source is refrigerator rising at peak levels in few years, while the fewest ratio of household in washing machine and the figure fluctuation over the decades. It is noticeable that number of hours of housework decline rapidly over the years.
To commence, 0% of household initiate in 1920 of refrigerator and untill 1940 it rose dramatically from 0% to 55%. Moreover, again in 1940 to 1960 incredebal rise in refrigerator from 555 to 90%. In addition, after few years the amount for the percentage become climbs slowly. Secondly, vacuum cleaner that begin with 30% of households and till 1980 it Escalated significantly from 30% to 90%. Nevertheless, after in 1980 the figure growing gradully and also it attache with top refrigerator at 100%.
On the other hand, the washing machine which fluctuated the ratio and it begin in 1920 with 40% households and until 2019 it rising over the 75% only. Regarding to housework per week is diminished dramatic in 1920 and 2019. Consequently, in 1920 the housework at 50% but in 1960 it drop from 50% to 20%. Finally, major trends have seen in between 1960 and 2019 that only plummet 10%.
AI examiner evaluation
| Criterion | Band |
|---|---|
| Task Achievement / Task Response | 5.5 |
| Coherence and Cohesion | 5.5 |
| Lexical Resource | 5.5 |
| Grammatical Range and Accuracy | 5.0 |
| Overall | 5.5 |
Task Achievement / Task Response: Band 5.5
You cover both charts and identify the broad contrast: appliance ownership generally increased, while housework time fell. You also report several relevant figures, including refrigerators rising to 100% and vacuum cleaners reaching 90% by 1980. However, the overview is unclear and includes an inaccurate claim that washing machines had the fewest household share; refrigerators were lowest at the start, and washing machines were not consistently the least common. Some data are misreported: refrigerators were about 2%, not 0%, in 1920, and the final housework figure is 11 hours, not a percentage. The account also omits the plateau in housework from 1980 to 2000 and gives limited comparison across all series. Select the main trends more precisely and distinguish hours from percentages.
Coherence and Cohesion: Band 5.5
The response has a recognisable structure, with an introduction, an overview and separate discussion of appliance ownership and housework. This helps the reader identify the two chart topics. However, progression within paragraphs is sometimes difficult to follow: phrases such as “To commence,” “Moreover,” and “Secondly” do not always signal a clear relationship between the data. The appliance paragraph moves between refrigerators and vacuum cleaners without consistently anchoring each change to the relevant years, while “after few years” is vague. The final paragraph combines washing-machine figures with housework, making the comparison less clear. Organise the details into clearly grouped trends, use year-to-year links, and make references such as “the figure” explicit.
Lexical Resource: Band 5.5
You attempt a range of trend vocabulary, including “rose dramatically,” “Escalated significantly,” “fluctuated,” and “diminished,” which is appropriate in principle for describing charts. However, inaccurate word choice and collocation often make the meaning unclear: “the most dominant source” does not describe appliance ownership, and “the amount for the percentage become climbs slowly” is difficult to interpret. There are also noticeable spelling and word-form errors, such as “untill,” “incredebal,” and “gradully.” Use standard chart language consistently, for example “the proportion of households owning refrigerators,” “levelled off,” and “declined.” Check spelling and avoid using several different expressions when a precise, familiar term is available.
Grammatical Range and Accuracy: Band 5.0
You attempt both simple and longer sentences, but control is uneven, and errors in sentence structure and verb forms sometimes make the data difficult to understand. For example, “the most dominant source is refrigerator rising at peak levels” lacks a clear grammatical structure, while “the figure growing gradully” needs a finite verb such as “the figure grew gradually.” There are also problems with articles, agreement and sentence construction in “0% of household initiate in 1920” and “the washing machine which fluctuated the ratio.” The final comparison, “it drop from 50% to 20%,” also has an incorrect verb form and unit. Build shorter, complete sentences first, then add subordinate clauses only when their grammar is secure.
See this exact question answered at other band scores. The same prompt compared across bands.
Browse more IELTS Writing model answers or get your own writing scored by the same AI examiner.