Band 6.0 IELTS Writing Task 1 Model Answer
Overall Band Score: 6.0 · Cambridge IELTS 16 · 2026-11-18
IELTS Writing Task 1 question
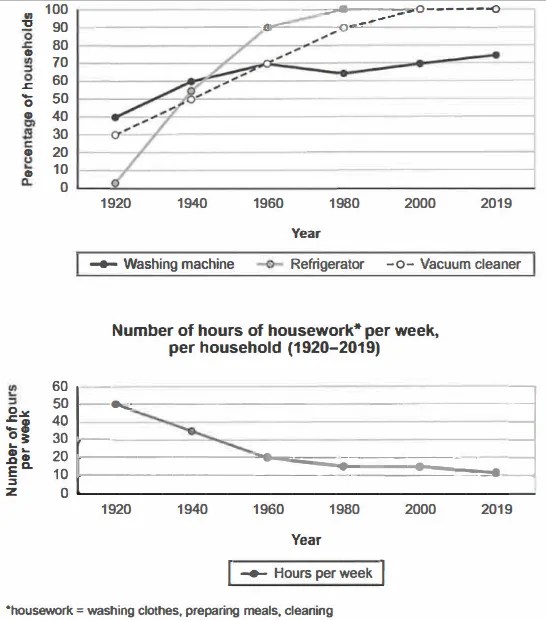
The charts below show the changes in ownership of electrical appliances and amount of time spent doing housework in households in one country between 1920 and 2019.
Summarise the information by selecting and reporting the main features, and make comparisons where relevant.
Percentage of households with electrical appliances (1920-2019)
Student answer (Band 6.0)
The line graphs display the changes in percentage of household of electrical appliances and number of hours of housework per week in one country between 1920 to 2019.
Overall, a refrigerator and a vacuum cleaner had highest percentage of households at end of the timeline. A washing machine had nearly straight graph throughout the timeline. The number of hours of housework per week had decreased over the period.
When talking about percentage of households with electrical appliances, refrigerator had lowest proportion appoximately 2% of households and washing machine had highest proportion nearly 40% of households in 1920. However, this graph shows dramatic difference in 1960 compared to 1920 because refrigerator had 90% of households in 1940 and other two stayed at 70% of households in 1960. While talking end of the timeline, refrigerator and vacuum cleaner ended at highest numbers in 2019 which was 100% of households and comparing this with washing maching was at nearly 70% of households.
Talking about numbers of hours per week, this graph shows downward trend compared with first graph. In 1920, numbers of hour per week was 50 hours and this graph made down trend and stayed at 20 hours in 1960. This trend continues throughout the 2019 and numbers were at 10 hours in end of the timeline.
AI examiner evaluation
| Criterion | Band |
|---|---|
| Task Achievement / Task Response | 6.0 |
| Coherence and Cohesion | 6.0 |
| Lexical Resource | 6.0 |
| Grammatical Range and Accuracy | 5.5 |
| Overall | 6.0 |
Task Achievement / Task Response: Band 6.0
You cover both graphs and identify the main broad patterns: appliance ownership generally rose, while weekly housework fell. You also report useful endpoint figures, including refrigerators at about 2% initially and both refrigerators and vacuum cleaners at 100% in 2019. However, some comparisons are unclear or inaccurate. You say the refrigerator reached 90% “in 1940,” whereas the chart shows about 55% then and 90% in 1960; the washing machine and vacuum cleaner were both around 70% in 1960. The overview’s claim that washing-machine ownership had a “nearly straight graph” is also misleading, since it rose overall with a dip around 1980. More precise reporting of the intermediate trends would make the summary more complete and clear.
Coherence and Cohesion: Band 6.0
The response has a recognisable structure: an introduction, an overview, and separate paragraphs for appliance ownership and housework. This gives the reader a coherent overall route through the information. Some linking is mechanical or awkward, however, particularly the repeated openings “When talking about…” and “While talking…”; these do not always make the relationship between details clear. The sentence beginning “However, this graph shows dramatic difference…” combines a comparison across years with figures that are difficult to follow. Organise the appliance paragraph chronologically or group the main trends, and use clearer transitions such as “By 1960” and “By contrast” to improve progression and cohesion.
Lexical Resource: Band 6.0
You use an adequate range of task-related vocabulary, including “percentage,” “proportion,” “downward trend,” and “timeline,” and the meaning is generally understandable. There are also attempts at more descriptive language, such as “dramatic difference,” though this phrase is not precise for the comparison being made. Some word choices and collocations are unnatural or repetitive: “made down trend,” “stayed at 20 hours,” and “ended at highest numbers” could be expressed more idiomatically. Spelling slips such as “appoximately” and “maching” also reduce accuracy. Aim for precise trend language and check spelling; for example, describe a figure as “stood at” a value or a trend as “declined.”
Grammatical Range and Accuracy: Band 5.5
You attempt both simple and more complex sentence forms, and the overall meaning can usually be followed. Some grammatical errors remain, especially with articles, plurals, agreement, and sentence construction. For example, “percentage of household” needs a plural form, while “a refrigerator and a vacuum cleaner had highest percentage” needs an article before “highest.” In “numbers of hour per week was 50 hours,” the plural noun conflicts with “was,” and the phrasing around “This trend continues throughout the 2019” is not grammatically well formed. There are also awkwardly joined clauses, as in “However, this graph shows dramatic difference… because…”. Review article use, singular/plural agreement, and sentence boundaries while retaining your attempts at complex structures.
See this exact question answered at other band scores. The same prompt compared across bands.
Browse more IELTS Writing model answers or get your own writing scored by the same AI examiner.