Band 6.0 IELTS Writing Task 1 Model Answer
Overall Band Score: 6.0 · Cambridge IELTS 16 · 2026-11-18
IELTS Writing Task 1 question
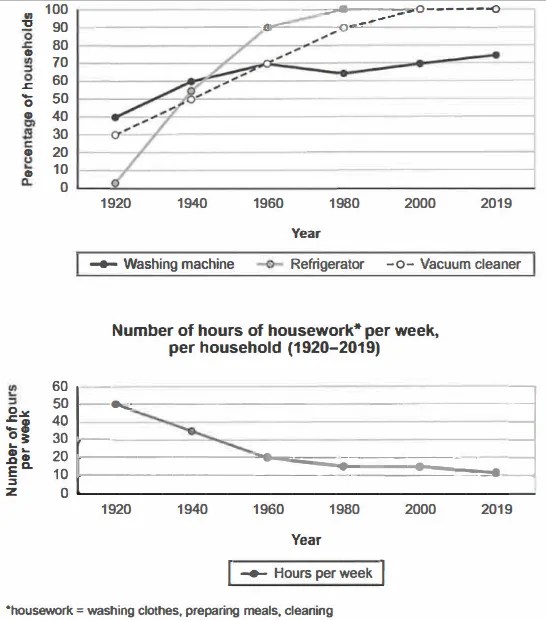
The charts below show the changes in ownership of electrical appliances and amount of time spent doing housework in households in one country between 1920 and 2019.
Summarise the information by selecting and reporting the main features, and make comparisons where relevant.
Percentage of households with electrical appliances (1920-2019)
Student answer (Band 6.0)
The line graphs illustrate the proportion of households with electrical appliances namely, washing machine, refrigerator and vacuum cleaner. And the number of hours spent in housework namely, wash per week between 1920 and 2019.
Overall, the first line graph indicates that refrigerator and vacuum cleaner were the most dominant figure overtime, whereas the second line graph reveals the hours spent per week in housework.
Firstly, in 1920 refrigerator began from zero percentage and by 1940 reached a proportion over 50%, regardless vacuum cleaner started from 30% and consistently increased to reach 50%, by the end of the timeframe both electricals rose significantly and recorded 100 percentage. whereas refrigerator was consistently stable at 100 percentage from 1980. Moreover, washing machine saw a fluctuated growth and recorded 70% by 2019.
Secondly, house work saw a significant plummeted overtime, by 1920 the the time consumed per week was 50 hours, whereas its started to decrease consistently and slightly. Furthermore, the sharpest decrease was between 1920 and 1960 were dropped from 50 hours per week to 20 hours. In 2019 it recorded about 10 hours per week.
AI examiner evaluation
| Criterion | Band |
|---|---|
| Task Achievement / Task Response | 6.0 |
| Coherence and Cohesion | 6.5 |
| Lexical Resource | 6.0 |
| Grammatical Range and Accuracy | 5.5 |
| Overall | 6.0 |
Task Achievement / Task Response: Band 6.0
You cover both graphs and identify the broad patterns: appliance ownership generally rose, while weekly housework time fell from 50 hours to about 11. You also report several relevant figures, including the refrigerator reaching 100% in 1980 and the vacuum cleaner reaching full ownership by 2000. However, the overview is not sufficiently precise: saying the refrigerator and vacuum cleaner were the “most dominant” does not clearly summarise the contrast across the period, and the washing-machine trend is only briefly described. Some details are inaccurate or incomplete: the refrigerator began at about 2%, not zero, and the washing-machine figure dipped from 70% to 65% in 1980 before rising. A clearer overview and more balanced comparisons would strengthen the report.
Coherence and Cohesion: Band 6.5
The response has a clear overall arrangement: an introduction, an overview, and separate paragraphs for appliance ownership and housework. “Firstly” and “Secondly” help signal the shift between the two charts, and the reader can follow the main chronological trends. This meets the lower-band expectation of coherent organisation, with some evidence of more controlled progression. However, linking is sometimes mechanical, and punctuation makes relationships between ideas unclear. For example, “whereas refrigerator was consistently stable at 100 percentage from 1980” is attached awkwardly to the preceding sentence, while “Overall” does not introduce a sufficiently clear summary. Use complete sentences and connect comparisons more naturally, grouping related appliance trends rather than relying mainly on sequencing words.
Lexical Resource: Band 6.0
You use an adequate range of task-related vocabulary, including “proportion,” “consistently,” “recorded,” and “sharpest decrease,” so the main trends are generally understandable. There are also attempts at more formal reporting language. However, several word choices and collocations are inaccurate or unnatural, such as “most dominant figure,” “saw a fluctuated growth,” and “house work saw a significant plummeted.” “Electricals” is also imprecise when referring to appliances, and “wash” does not accurately describe the broader category of housework. These choices sometimes make the description less clear, even though the intended meaning can usually be inferred. Prefer precise trend language such as “ownership,” “fluctuated,” “declined,” and “housework hours.”
Grammatical Range and Accuracy: Band 5.5
You attempt both simple and more complex sentence forms, including comparisons with “whereas” and time clauses such as “by the end of the timeframe.” The main message remains understandable, but some grammatical errors occur in sentence construction, verb forms, and punctuation. For example, “And the number of hours…” is a sentence fragment, “washing machine saw a fluctuated growth” has an incorrect verb pattern, and “the sharpest decrease was between 1920 and 1960 were dropped” combines incompatible structures. There are also errors in “its started” and the repeated “the the.” Improve control by checking subject–verb structure and making each sentence complete; for instance, write “The sharpest decrease occurred between 1920 and 1960, when the figure fell…”
See this exact question answered at other band scores. The same prompt compared across bands.
Browse more IELTS Writing model answers or get your own writing scored by the same AI examiner.