Band 4.5 IELTS Writing Task 1 Model Answer
Overall Band Score: 4.5 · Cambridge IELTS 16 · 2026-11-18
IELTS Writing Task 1 question
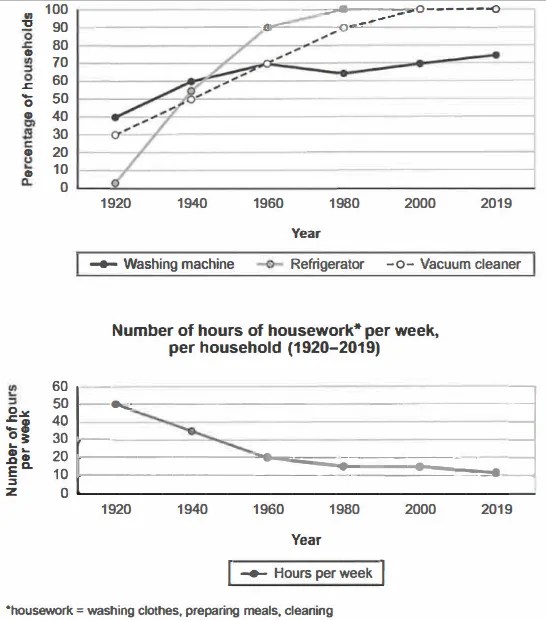
The charts below show the changes in ownership of electrical appliances and amount of time spent doing housework in households in one country between 1920 and 2019.
Summarise the information by selecting and reporting the main features, and make comparisons where relevant.
Percentage of households with electrical appliances (1920-2019)
Student answer (Band 4.5)
The chart illustrate the change in ownership of electrical appliance and amount of time spent doing housework in household in one country between 1920 and 2019 .
The percentage of households with electrical appliances 1920and 2019,
In 1920 the refrigerator was lowest percentage 0% , and washing machine was the highest percentage 40% comparison by refrigerator and vacuum cleaner.
In 1920 was the percentage low refrigerator but In 2000 the percentage grew up
100%, in washing machine was the percentage 40 1920, but some time increase and decrease and than 2019 increase percentage 70.5
Vacuum cleaner in 1920, was the percentage 30% and after a years more increase the percentage 100.
And hours of house hold per week per house hold1920 to 2019
In 1920, was the percentage oh hours per week 50 percentage, but the 1940, slightly decrease percentage between 40 to 30%. In 1960 was the number of hours
fastly fall 20%,
sharply decrease the percentage of 2019 10%, 1980 to 2000 , mostly close
AI examiner evaluation
| Criterion | Band |
|---|---|
| Task Achievement / Task Response | 5.0 |
| Coherence and Cohesion | 4.0 |
| Lexical Resource | 5.0 |
| Grammatical Range and Accuracy | 4.5 |
| Overall | 4.5 |
Task Achievement / Task Response: Band 5.0
You identify the two subjects and the overall period, and you report several relevant figures, including washing machines at 40% in 1920, vacuum cleaners at 30%, and housework at about 50 hours initially. However, the response only partially covers the data and lacks a clear overview of the main trends. Some details are inaccurate or unclear: the refrigerator starts at about 2%, not 0%; washing-machine ownership ends at about 75%, rather than 70.5%; and the 1940 housework figure is about 35 hours, not a range of 30–40%. You also omit the refrigerator’s rise to 100% by 1980 and the vacuum cleaner’s gradual rise to full ownership by 2000. Summarise these broad patterns before selecting key comparisons.
Coherence and Cohesion: Band 4.0
There is some basic organisation: the response moves from appliance ownership to housework, and separate paragraphs indicate these topics. However, the information within each section does not follow a consistently clear progression. For example, the appliance paragraph shifts from 1920 to 2000 and then back to washing machines without clearly comparing the series, while the final housework section gives years in a confusing order. Linking phrases such as “but,” “after a years,” and “and than” are repetitive or do not show the intended relationship clearly. Use one paragraph for the appliance trends and one for housework, and present each in chronological order, with clear comparisons and an overview.
Lexical Resource: Band 5.0
Your vocabulary is sufficient to identify the main chart topics, using terms such as “ownership,” “percentage,” “increase,” and “decrease.” However, the range is limited and several expressions are repeated, while inaccurate word choices sometimes make the data difficult to interpret. For instance, “the percentage of hours” confuses a percentage with a number of hours, and “fastly fall” is not a natural way to describe a decline. Phrases such as “some time increase and decrease” and “after a years more increase” are also imprecise. Build a more varied set of trend expressions and use the chart’s units accurately: describe appliance ownership in percentages and housework in hours per week.
Grammatical Range and Accuracy: Band 4.5
The response attempts to describe changes over time, but sentence structures are mostly simple or incomplete, and errors frequently affect clarity. Examples include “The chart illustrate,” where the subject and verb do not agree, and “In 1920 was the percentage low refrigerator,” which lacks a clear grammatical structure. Articles and prepositions are often missing or misplaced, as in “in household” and “in 1920and 2019.” Tense and clause construction are also unreliable in “some time increase and decrease and than 2019 increase percentage.” Practise complete sentences with a clear subject and verb, and use past-tense forms consistently for the historical data. A few accurate comparative or complex sentences would help express trends more clearly.
See this exact question answered at other band scores. The same prompt compared across bands.
Browse more IELTS Writing model answers or get your own writing scored by the same AI examiner.