Band 5.0 IELTS Writing Task 1 Model Answer
Overall Band Score: 5.0 · Cambridge IELTS 16 · 2026-11-18
IELTS Writing Task 1 question
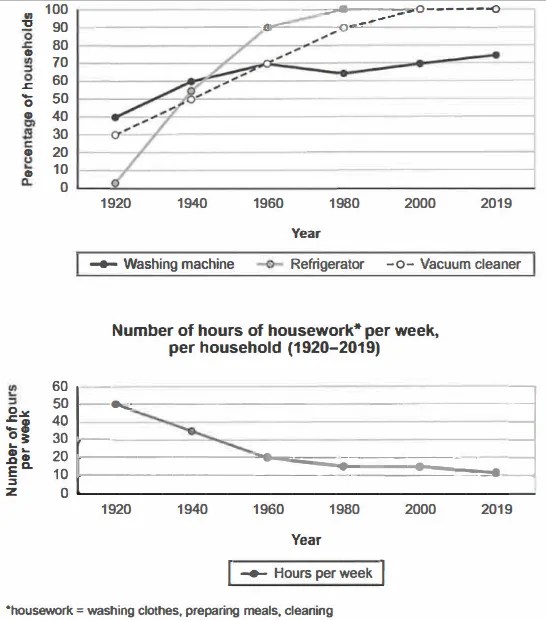
The charts below show the changes in ownership of electrical appliances and amount of time spent doing housework in households in one country between 1920 and 2019.
Summarise the information by selecting and reporting the main features, and make comparisons where relevant.
Percentage of households with electrical appliances (1920-2019)
Student answer (Band 5.0)
The chart above shows the changes in ownership of electrical appliances and how much amount of time spent doing housework in households in one country between [redacted phone]. people used washing machine to wash clothes, refrigerator for storing the fruits and vegetables to keep them fresh and vacuum cleaner to clean the entire house, it made it easier to do the household chores. overall in 1920 number of hours of housework was fifty percent a week. The use of refrigerator was zero percent and washing machine was used about forty percent, meanwhile vacuum cleaner was owned by thirty percent household. During 1940 fifty percent of housework reduce to thirty percent. sixty percent of household owned the washing machine, the percentage of refrigerator owned increased to fifty percent compare to the year 1920. Same as the percentage of vacuum cleaner increased by fifty percent too. In the year 1960 the number of hours of housework decreased by forty percent. which shows that, more number of households owned washing machine, which seventy percent increased. refrigerator and vacuum cleaner are owned by ninety percent and seventy percent.
During the year 1980 - 2000 number of hours of housework per week per household decreased by twenty percent.
AI examiner evaluation
| Criterion | Band |
|---|---|
| Task Achievement / Task Response | 5.0 |
| Coherence and Cohesion | 5.0 |
| Lexical Resource | 5.0 |
| Grammatical Range and Accuracy | 5.0 |
| Overall | 5.0 |
Task Achievement / Task Response: Band 5.0
You identify the broad topic and report several relevant figures, including washing-machine ownership at 40% in 1920 and 70% in 1960, and the rise in refrigerator ownership by 1940. However, the response only partially covers the task: it gives no account of the final 2019 figures and does not clearly summarise the overall pattern across both charts. The overview is also missing; the opening explanation of what appliances are used for does not replace a summary of the main trends. Some data are inaccurate or unclear: refrigerator ownership was about 2%, not zero, in 1920, and housework fell from 50 to 35 hours by 1940, not by a stated percentage. Select the key trends and compare them accurately.
Coherence and Cohesion: Band 5.0
There is some organisation: the response moves through 1920, 1940 and 1960, then begins a paragraph for 1980–2000. This chronological approach gives the reader a basic framework. However, the progression is incomplete and uneven, with the account stopping before 2019 and the second paragraph containing only one brief statement. Linking is often mechanical or unclear, as in “During 1940” and “Same as the percentage…,” while the long opening sentence mixes the chart introduction with explanations of appliance uses. Group the information into a clear introduction, an overview, and logically organised detail paragraphs. Use comparisons between the appliance trends and housework hours to create a more connected account.
Lexical Resource: Band 5.0
The response uses enough basic topic vocabulary to communicate the subject, including “ownership,” “household chores,” “percentage,” and the names of the appliances. However, the range is limited and several choices or combinations are inaccurate or awkward, such as “how much amount of time,” “the percentage of refrigerator owned,” and “increased by fifty percent too.” Repetition of “owned” and “increased” also makes the description less precise. Use vocabulary suited to describing data, such as “the proportion of households with…,” “rose to,” “fell to,” and “remained stable.” Take care to distinguish a percentage-point change from a final percentage, and use concise, natural phrasing rather than explaining the appliances’ everyday functions.
Grammatical Range and Accuracy: Band 5.0
The response attempts some longer sentences and uses time references to organise the data, but sentence structures are limited and errors are frequent. For example, “which seventy percent increased” lacks a clear grammatical structure, while “During 1940 fifty percent of housework reduce to thirty percent” has problems with tense and sentence formation. There are also sentence-boundary and capitalisation errors, such as the lower-case “people” after the opening sentence and the fragment “which shows that…”. These issues sometimes make relationships between figures difficult to follow. Practise forming complete sentences with accurate past-tense verbs, for example, “In 1940, washing-machine ownership rose to 60%, while housework fell to 35 hours per week.” Use full stops and commas to separate ideas clearly.
See this exact question answered at other band scores. The same prompt compared across bands.
Browse more IELTS Writing model answers or get your own writing scored by the same AI examiner.